-
Notifications
You must be signed in to change notification settings - Fork 48
Snapshot Method Calls Report
Snapshot Method Calls report provides information about Call Graph data for all Snapshots in APM Applications.
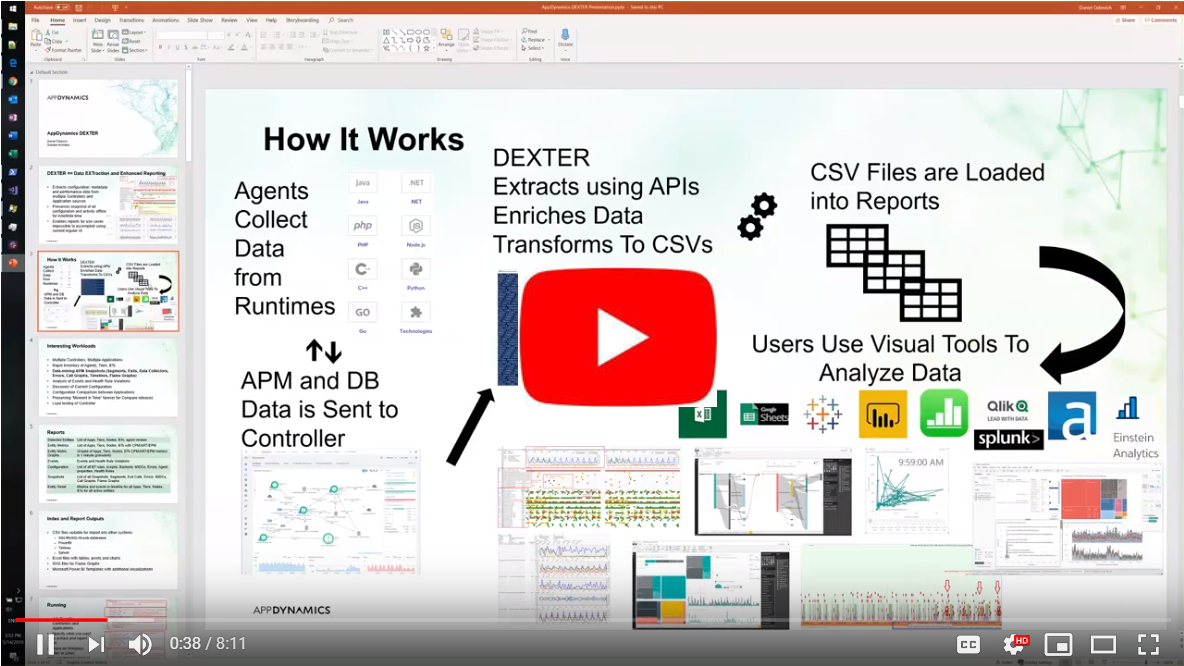
You can also watch this training video:
Snapshot Method Calls report is produced when:
- Job file included at least one APM application Target.Type=
APM - Metadata is extracted via Input.DetectedEntities=
true - Snapshots are extracted via Input.Snapshots=
true - Report is requested via Output.Snapshots=
true
Snapshot Method Calls report has the following file name:
Report\CallGraphs.<Job File Name>.<Start Date and Time in yyyyMMddHHmm>.<Number Of Hours Spanned By Report>.xlsx
For example:
CallGraphs.demo1demo2.2017123001-2017123003.xlsx
The data for the report is in the following files:
- Report\SNAP\snapshots.methodcalllines.csv
| Data | Pivot |
|---|---|
| 1.Parameters | |
| 2.Contents | |
| 3.Controllers | |
| 4.Appplications | |
| 11.Method Calls | 11.Calls.Type, 11.Calls.Location, 11.Calls.Timeline |
| 12.Call Occurrences | 12.Call Occurrences.Type |
This sheet describes the parameters of the extraction and reporting job that produced this report.
| Column | Data Type | Purpose |
|---|---|---|
| Controller | URL | Controller that was queried |
| UserName | String | User that was used to retrieve data from the Controller |
| Application | String | Name of Application that was queried |
| ApplicationID | Integer | ID of Application in Controller |
| ApplicationType | String | Type of the Application |
This sheet provides quick access to the contents of this report and provides at-a-glance number of rows in each of the sheet's tables.
| Column | Data Type | Purpose |
|---|---|---|
| Sheet Name | String | Name of the sheet in the report |
| Num Entities | Integer | Number of Entities in that sheet |
| Link | Hyperlink | Link to the sheet in the report |
This sheet provides information about Controllers covered by this report.
| Column | Data Type | Purpose |
|---|---|---|
| Controller | URL | Controller that was queried |
| Version | String | Version of the Controller |
| VersionDetail | String | Full version string of the Controller |
| NumApps | Integer | Number of all APM Applications registered in the Controller |
| NumAPMApps | Integer | Number of APM Applications registered in the Controller |
| NumWEBApps | Integer | Number of WEB Applications registered in the Controller |
| NumMOBILEApps | Integer | Number of MOBILE Applications registered in the Controller |
| NumIOTApps | Integer | Number of IoT Applications registered in the Controller |
| NumSIMApps | Integer | Number of SIM Applications registered in the Controller |
| NumBIQApps | Integer | Number of BIQ Applications registered in the Controller |
| NumDBApps | Integer | Number of DB Applications registered in the Controller |
| ControllerLink | URL | Link to Controller |
This sheet provides Snapshot summary information about all Applications in all Controllers covered by this report.
| Column | Data Type | Purpose |
|---|---|---|
| Controller | URL | Controller that was queried |
| ApplicationName | String | Name of Application |
| NumSnapshots | Integer | Total number of Snapshots |
| NumSnapshotsNormal | Integer | Total number of Snapshots with Normal user experience |
| NumSnapshotsSlow | Integer | Total number of Snapshots with Slow user experience |
| NumSnapshotsVerySlow | Integer | Total number of Snapshots with Very Slow user experience |
| NumSnapshotsStall | Integer | Total number of Snapshots with Stall user experience |
| NumSnapshotsError | Integer | Total number of Snapshots with Error user experience |
| HasActivity | Boolean | Whether this Entity had any activity |
| From | DateTime | Beginning of time range queried, local time |
| To | DateTime | End of time range queried, local time |
| FromUtc | DateTime | Beginning of time range queried, UTC time |
| ToUtc | DateTime | End of time range queried, UTC time |
| Duration | Integer | Duration of time range queried, in minutes |
| ApplicationID | Integer | ID of Application in Controller |
| DetailLink | Hyperlink | Link to the Entity Details report |
| ControllerLink | URL | Link to Controller for this time range |
| ApplicationLink | URL | Link to Application in Controller for this time range |
This sheet provides information about every method in all Segments in all Snapshots that occurred in the specified time range in all Applications in all Controllers covered by this report. It is equivalent to the Call Graph view of the Snapshot/Segment in AppDynamics UI.
| Column | Data Type | Purpose |
|---|---|---|
| Controller | URL | Controller that was queried |
| ApplicationName | String | Name of Application |
| TierName | String | Name of Tier where this Business Transaction started |
| TierType | String | Type of Tier where this Business Transaction started |
| NodeName | String | Name of Node where this Business Transaction started |
| AgentType | String | Type of Agent reporting to this Tier |
| BTName | String | Name of Business Transaction |
| BTType | String | Type of Business Transaction |
| SegmentUserExperience | String | User Experience (NORMAL, SLOW, VERY_SLOW, STALL, ERROR) of Segment |
| SnapshotUserExperience | String | User Experience (NORMAL, SLOW, VERY_SLOW, STALL, ERROR) of Snapshot |
| RequestID | GUID | Unique ID of this Snapshot |
| SegmentID | Integer | Unique ID of this Segment in this Snapshot |
| Occurred | DateTime | When Method Call was made, local time |
| OccurredUtc | DateTime | When Method Call was made, UTC time |
| Type | String | Type of the method as determined by AppDynamics APM agent (POJO, POCO, SERVLET, SPRING_BEAN, JS, etc) |
| Framework | String | Type of framework as determined by indexing process using mapping from MethodNamespaceTypeMapping.csv |
| FullNameIndent | String | Full name of each call method, indented with same number of spaces as it is deep in the specific Segment’s call graph |
| Exec | Integer | Execution time of this method only |
| ExecTotal | Integer | Execution time of this method and its children |
| ExecToHere | Integer | Execution time elapsed up to this method |
| Wait | Integer | Wait time of this method only |
| WaitTotal | Integer | Wait time of this method and its children |
| Block | Integer | Block time of this method only |
| BlockTotal | Integer | Block time of this method and its children |
| CPU | Integer | CPU time of this method only |
| CPUTotal | Integer | CPU time of this method and its children |
| ExecRange | String | String representing bucket into which Exec fits |
| ExitCalls | String | List of Exit Calls made by this method |
| NumExits | Integer | Number of Exit Calls made by this method |
| HasErrors | Boolean | Whether any Exit Calls made by this method resulted in error |
| SEPs | String | List of Service Endpoints that were applied to this method |
| NumSEPs | Integer | Number of Service Endpoints that were applied to this method |
| MIDCs | String | List of Business Data captured via MIDCs. Only available if Input\Configuration=true, and if MIDCs are configured |
| NumMIDCs | Integer | Number of MIDCs configured on this method |
| NumChildren | Integer | Number of child method calls for this method |
| ElementType | String | Type of the call graph element, one of the following: Root – beginning of call graph Stem – middle of call graph, only 1 child Branch – middle of the call graph, more than 1 child Leaf – end of the call graph. Likely an exit, but may be non-trivial burn of time doing something |
| SequenceNumber | Integer | Line number in this Segment’s call graph |
| Depth | Integer | Depth of this method from the root element of Call Graph |
| PrettyName | String | More user-friendly name of the class/method combo that sometimes is displayed in the call graph, for things like Servlets and JMS |
| FullName | String | Combination of Class, Method and LineNumber |
| Class | String | Class of the Class/Method combo |
| Method | String | Method of the Class/Method combo |
| LineNumber | Integer | Line number of the Class/Method combo, if it was available and captured |
| ApplicationID | Integer | ID of Application in Controller |
| TierID | Integer | ID of Tier in Application |
| NodeID | Integer | ID of Node in Application |
| BTID | Integer | ID of Business Transaction in Application |
This sheet uses data in 11.Method Calls sheet as source for pivot table to enable summary reporting and ad-hoc drill-down.
Default configuration provides breakdown of Method Call Lines by Type, groups them by their Business Transaction and summarizes them by Type of call and Framework of call by Average Execution Duration.
| Columns | Rows | Values | Filters |
|---|---|---|---|
| Type | |||
| Framework | |||
| Controller | |||
| ApplicationName | |||
| AgentType | |||
| TierName | |||
| BTName | |||
| Exec (Average) | |||
| ElementType | |||
| NumChildren | |||
| NumExits | |||
| Depth | |||
| ExecRange |
Here is an example showing all the method calls that have no exits, and fall into range of 2000-5000ms:
Expanding that report shows all the calls to java.lang.Thread:Sleep:
Here is another example of all method calls with 2 exits that fall into 10000 to 15000 ms range:
This sheet uses data in 11.Method Calls sheet as source for pivot table to enable summary reporting and ad-hoc drill-down.
Default configuration provides breakdown of Method Calls by Type and Framework (determined using lookup of Class name via MethodNamespaceTypeMapping.csv), groups them by their Business Transaction and summarizes Average Execution Time by the Execution Range.
| Columns | Rows | Values | Filters |
|---|---|---|---|
| ExecRange | |||
| Type | |||
| Framework | |||
| FullName | |||
| Controller | |||
| ApplicationName | |||
| AgentType | |||
| TierName | |||
| BTName | |||
| Exec (Count) | |||
| ElementType | |||
| NumChildren | |||
| NumExits | |||
| Depth |
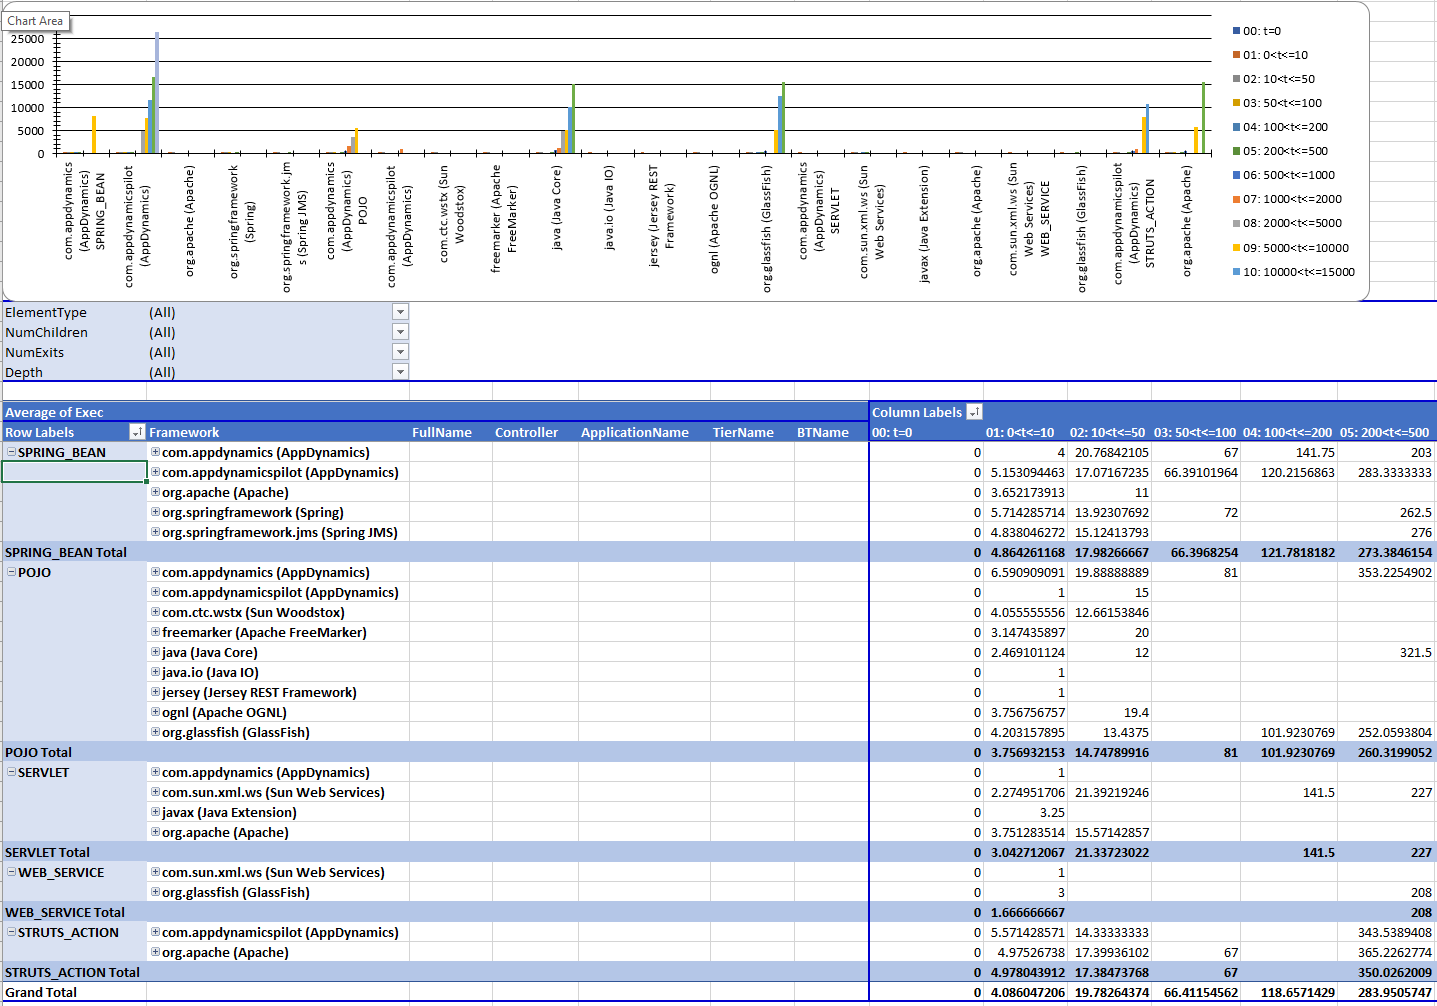
Here is an example showing breakdown of all the calls in Execution Duration buckets grouped by Type and Framework across 2 Applications across 2 Controllers:
Drilling down to specific Framework, we can have breakdown of the types of the code that may be slow:
The detail can be filtered further, here looking into bucket between 1000 and 2000 milliseconds:
This sheet uses data in 11.Method Calls sheet as source for pivot table to enable summary reporting and ad-hoc drill-down.
Default configuration provides per-minute summary of Average Durations of specific method calls, by Type and Framework.
| Columns | Rows | Values | Filters |
|---|---|---|---|
| Type | |||
| Framework | |||
| Occurred | |||
| Exec (Average) | |||
| ElementType | |||
| NumChildren | |||
| NumExits | |||
| Depth | |||
| Class | |||
| Method | |||
| FullName | |||
| BTName | |||
| ExecRange |
Here is an example showing all types of method calls across 3 hours. JS is clearly the slowest:
 Full Size
Filtering down to Type=JS, we can see that the slowest calls happened during the 7PM hour:
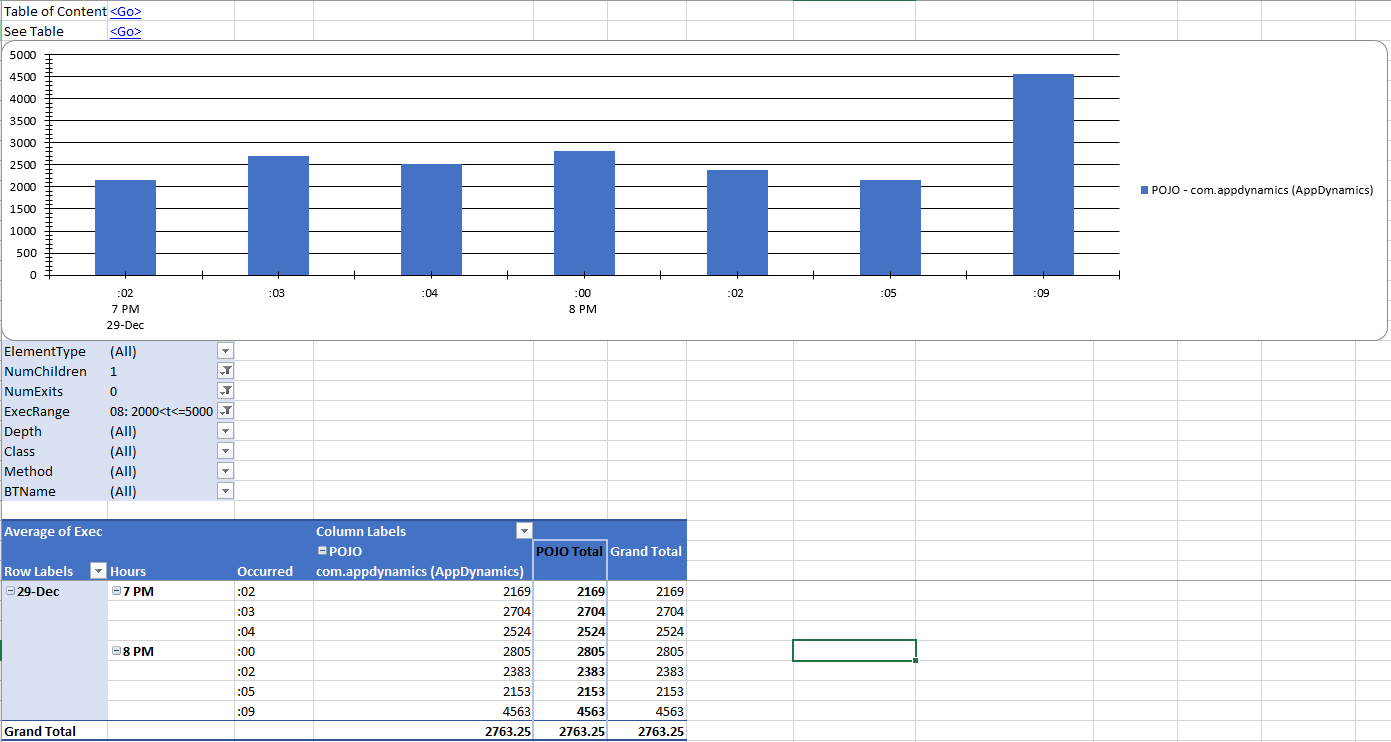
Filtering on Type=POJO and Framework=AppDynamics, we can see how the distribution of method calls to this type of calls looks like across 3 hours:
Filtering on Method Call elements with 1 child, but no exits, falling in the range between 2000 and 5000 milliseconds, we can see them occurring early in 7 and 8 am:
- Home
- Getting Started Walkthrough
- Run
-
Excel Reports
- Detected APM Entities
- Detected SIM Entities
- Detected DB Entities
- Detected WEB Entities
- Detected MOBILE Entities
- Detected BIQ Entities
- Entity Metrics
- Entity Metric Graphs
- Registered APM Metrics
- Entity Flowmaps
- Configuration
- Events and Health Rule Violations
- Entity Details
- Snapshots
- Snapshot Method Calls
- Individual Snapshot
- Users and Permissions
- Dashboards
- Health Check
- PowerBI Reports
- Tableau Reports
- Browser Reports


