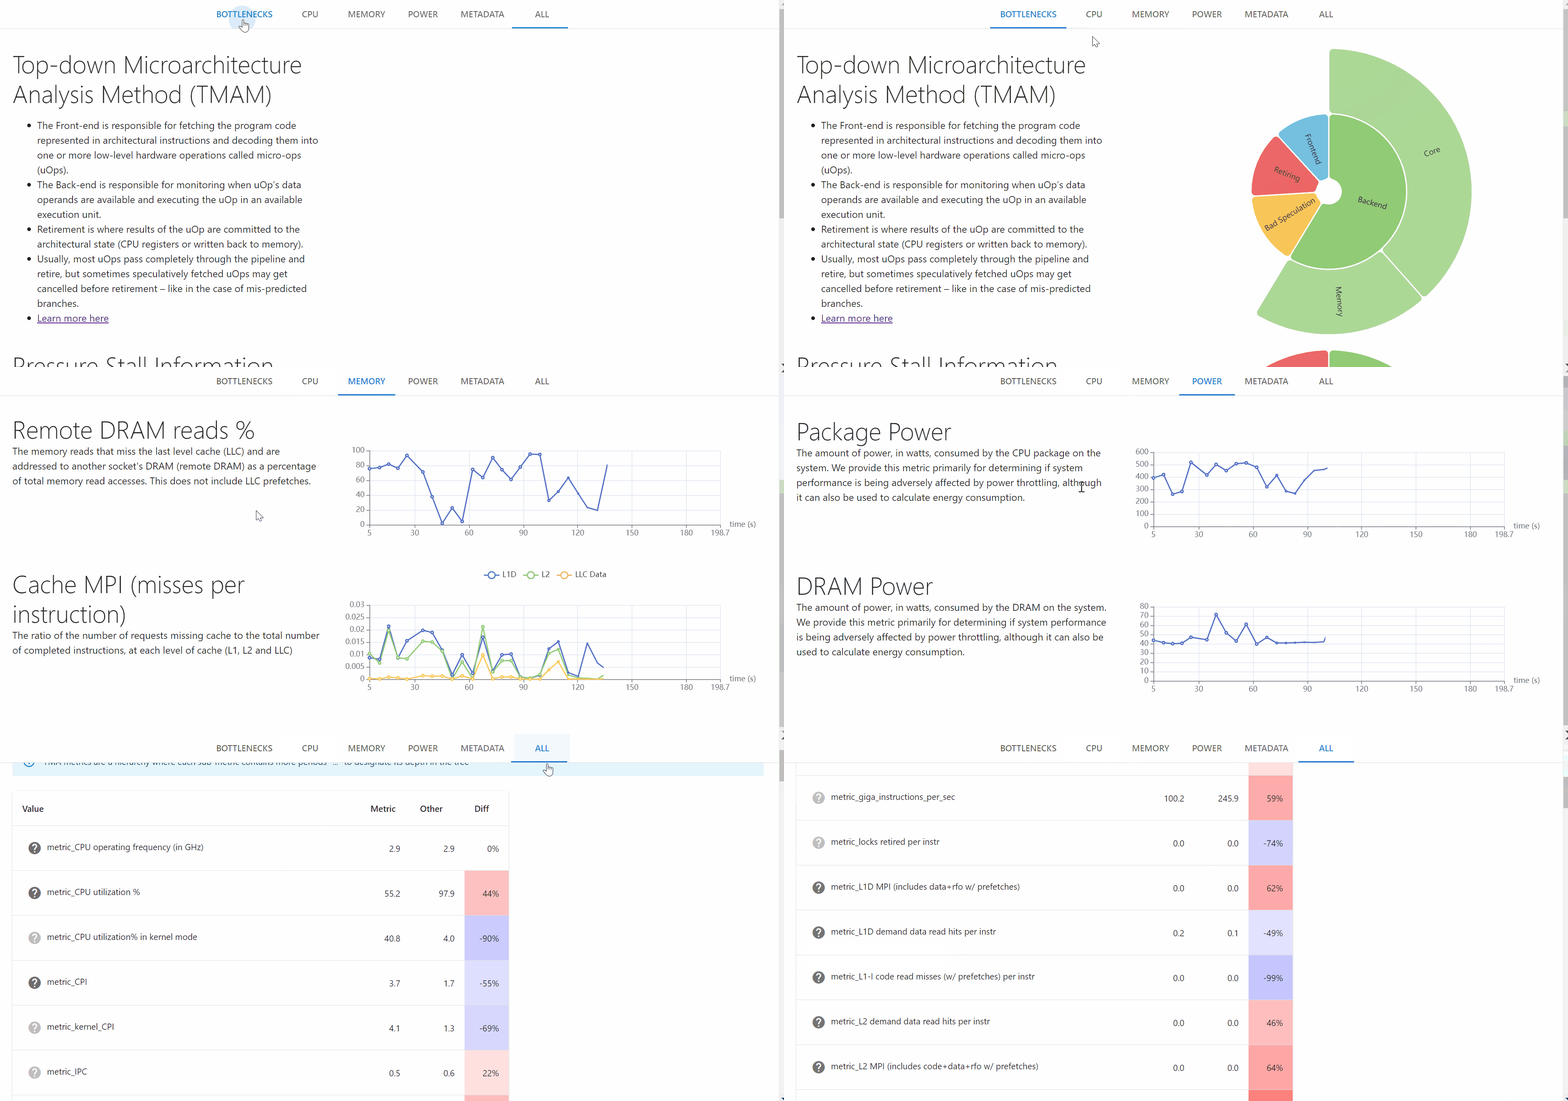
PerfSpect is a system performance characterization tool built on top of linux perf. It contains two parts:
perf-collect: Collects hardware events at a 5 second output interval with practically zero overhead since PMU's run in counting mode.
- Collection mode:
sudo ./perf-collectdefault system widesudo ./perf-collect --socketsudo ./perf-collect --cpusudo ./perf-collect --pid <process-id>sudo ./perf-collect --cidby default, selects the 5 containers using the most CPU at start of perf-collect. To monitor specific containers provide up to 5 comma separated cids i.e. <cid_1>,<cid_2>
- Duration:
sudo ./perf-collectdefault run until terminatedsudo ./perf-collect --timeout 10run for 10 secondssudo ./perf-collect --app "myapp.sh myparameter"runs for duration of another process
perf-postprocess: Calculates high level metrics from hardware events
./perf-postprocess
wget -qO- https://github.com/intel/PerfSpect/releases/latest/download/perfspect.tgz | tar xvz
cd perfspect
sudo ./perf-collect --timeout 10
./perf-postprocess
perf-collect outputs:
perfstat.csv: raw event counts with system metadata
perf-postprocess outputs:
metric_out.sys.average.csv: average metricsmetric_out.sys.csv: metric values at every 5 second intervalmetric_out.html: html view of a few select metrics
Modify the template deamonset.yml to deploy in kubernetes
perf - PerfSpect uses the Linux perf tool to collect PMU counters
Different events require different minimum kernels (PerfSpect will automatically collect only supported events)
- Base (CPU util, CPI, Cache misses, etc.)
- 3.10
- Uncore (NUMA traffic, DRAM traffic, etc.)
- 4.9
- TMA (Micro-architecture boundness breakdown)
- ICX, SPR: 5.10
- BDX, SKX, CLX: 3.10
Requires recent python. On successful build, binaries will be created in dist folder
pip3 install -r requirements.txt
make
Note: Most metrics and events come from perfmon and TMA v4.5


