This Repository contain all materials and files for my guided project on Coursera Platform Sales Analysis in Power BI: Clean and Analyze Sales Data
| No. | Topic |
|---|---|
| 01 | Main Outcome |
| 02 | Senario |
| 03 | Objectives |
| 04 | Tasks List |
| 05 | Guided Project Final Report |
| 06 | Capstone Project |
| 07 | Capstone Project Outcome |
By the end of this project, learner would go through the entire data analysis life cycle, he would start off by connecting to datasets, transform and clean it, build data model, ask valuable question and then answer them through effictive data visualization that would be used in building a sales report.
Learners would be tasked to analyze warehouse sales data that includes information about both its national and international sales, its sold products and their manufacturing data. they are to deliver a detailed interactive sales report for the stackeholders summerizing the answers for vital business questions.
- Transform different types of data in Power Query.
- Explore and build a data model.
- Build date table and practise time intelligence features.
- Create and optimize meaningful visualizations for Power BI report.
| No. | Task |
|---|---|
| 01 | Load dataset and connect to different file types |
| 02 | Explore dataset and decide transform/cleaning steps |
| 03 | Transform Geography & Products tables |
| 04 | Transform Manufacturer table |
| 05 | Append all sales tables |
| 06 | Build date table and intro to data model |
| 07 | Build interactive charts answering vital questions |
| 08 | Design and format charts and report pages |
Sales Analysis Power BI Report
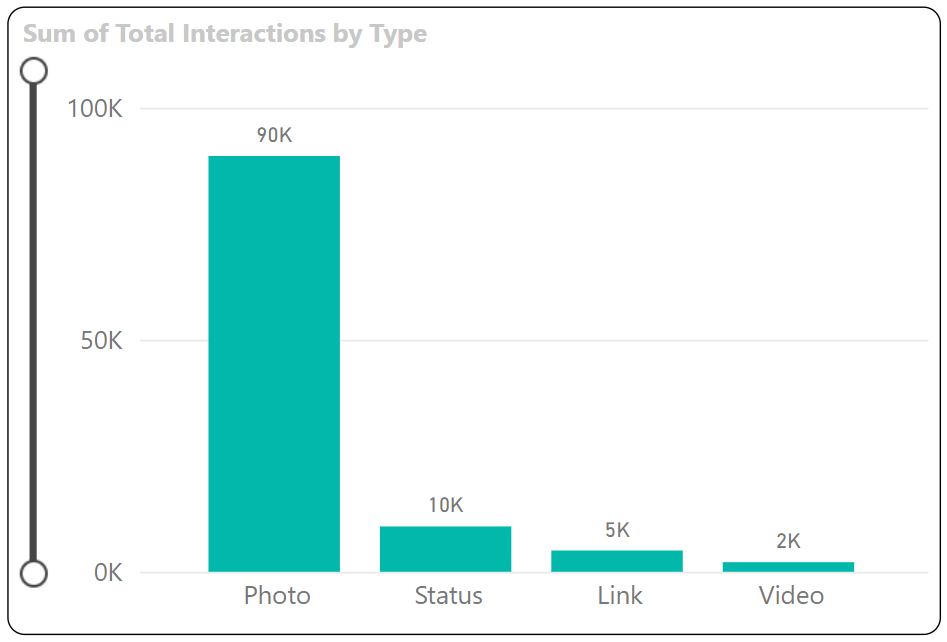
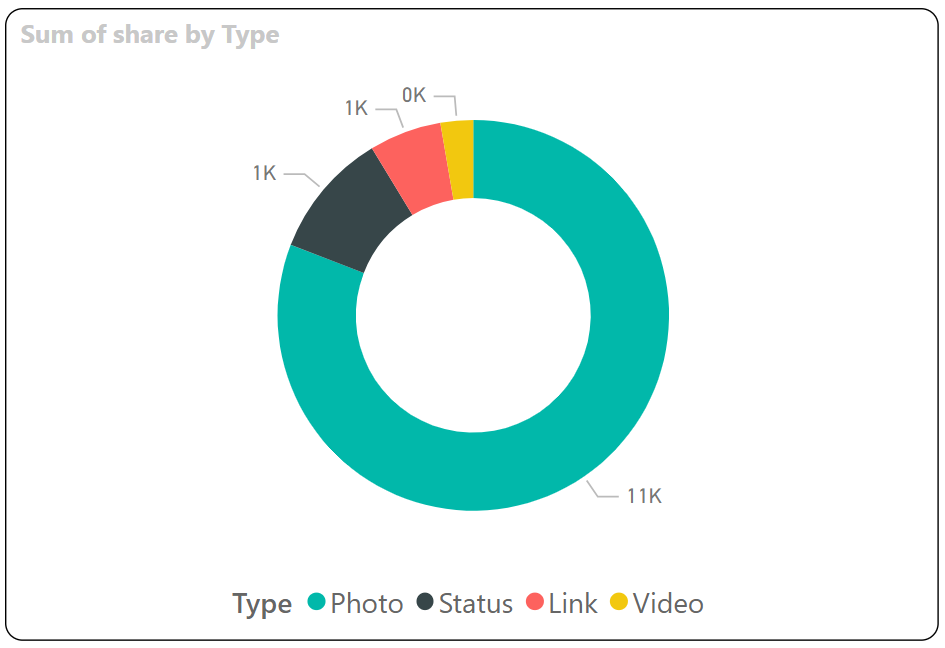
Learner would go through the entire data analysis life cycle steps. He would be tasked to load and transform the Facebook paid ads data comming from a cosmatics company, starting by connecting to the dataset, exploring and cleanining/transforming it, and finaly start building interactive visuals to gain insights from these campaign and answer the maneger's questions.
Capstone Question 1
Capstone Question 2


