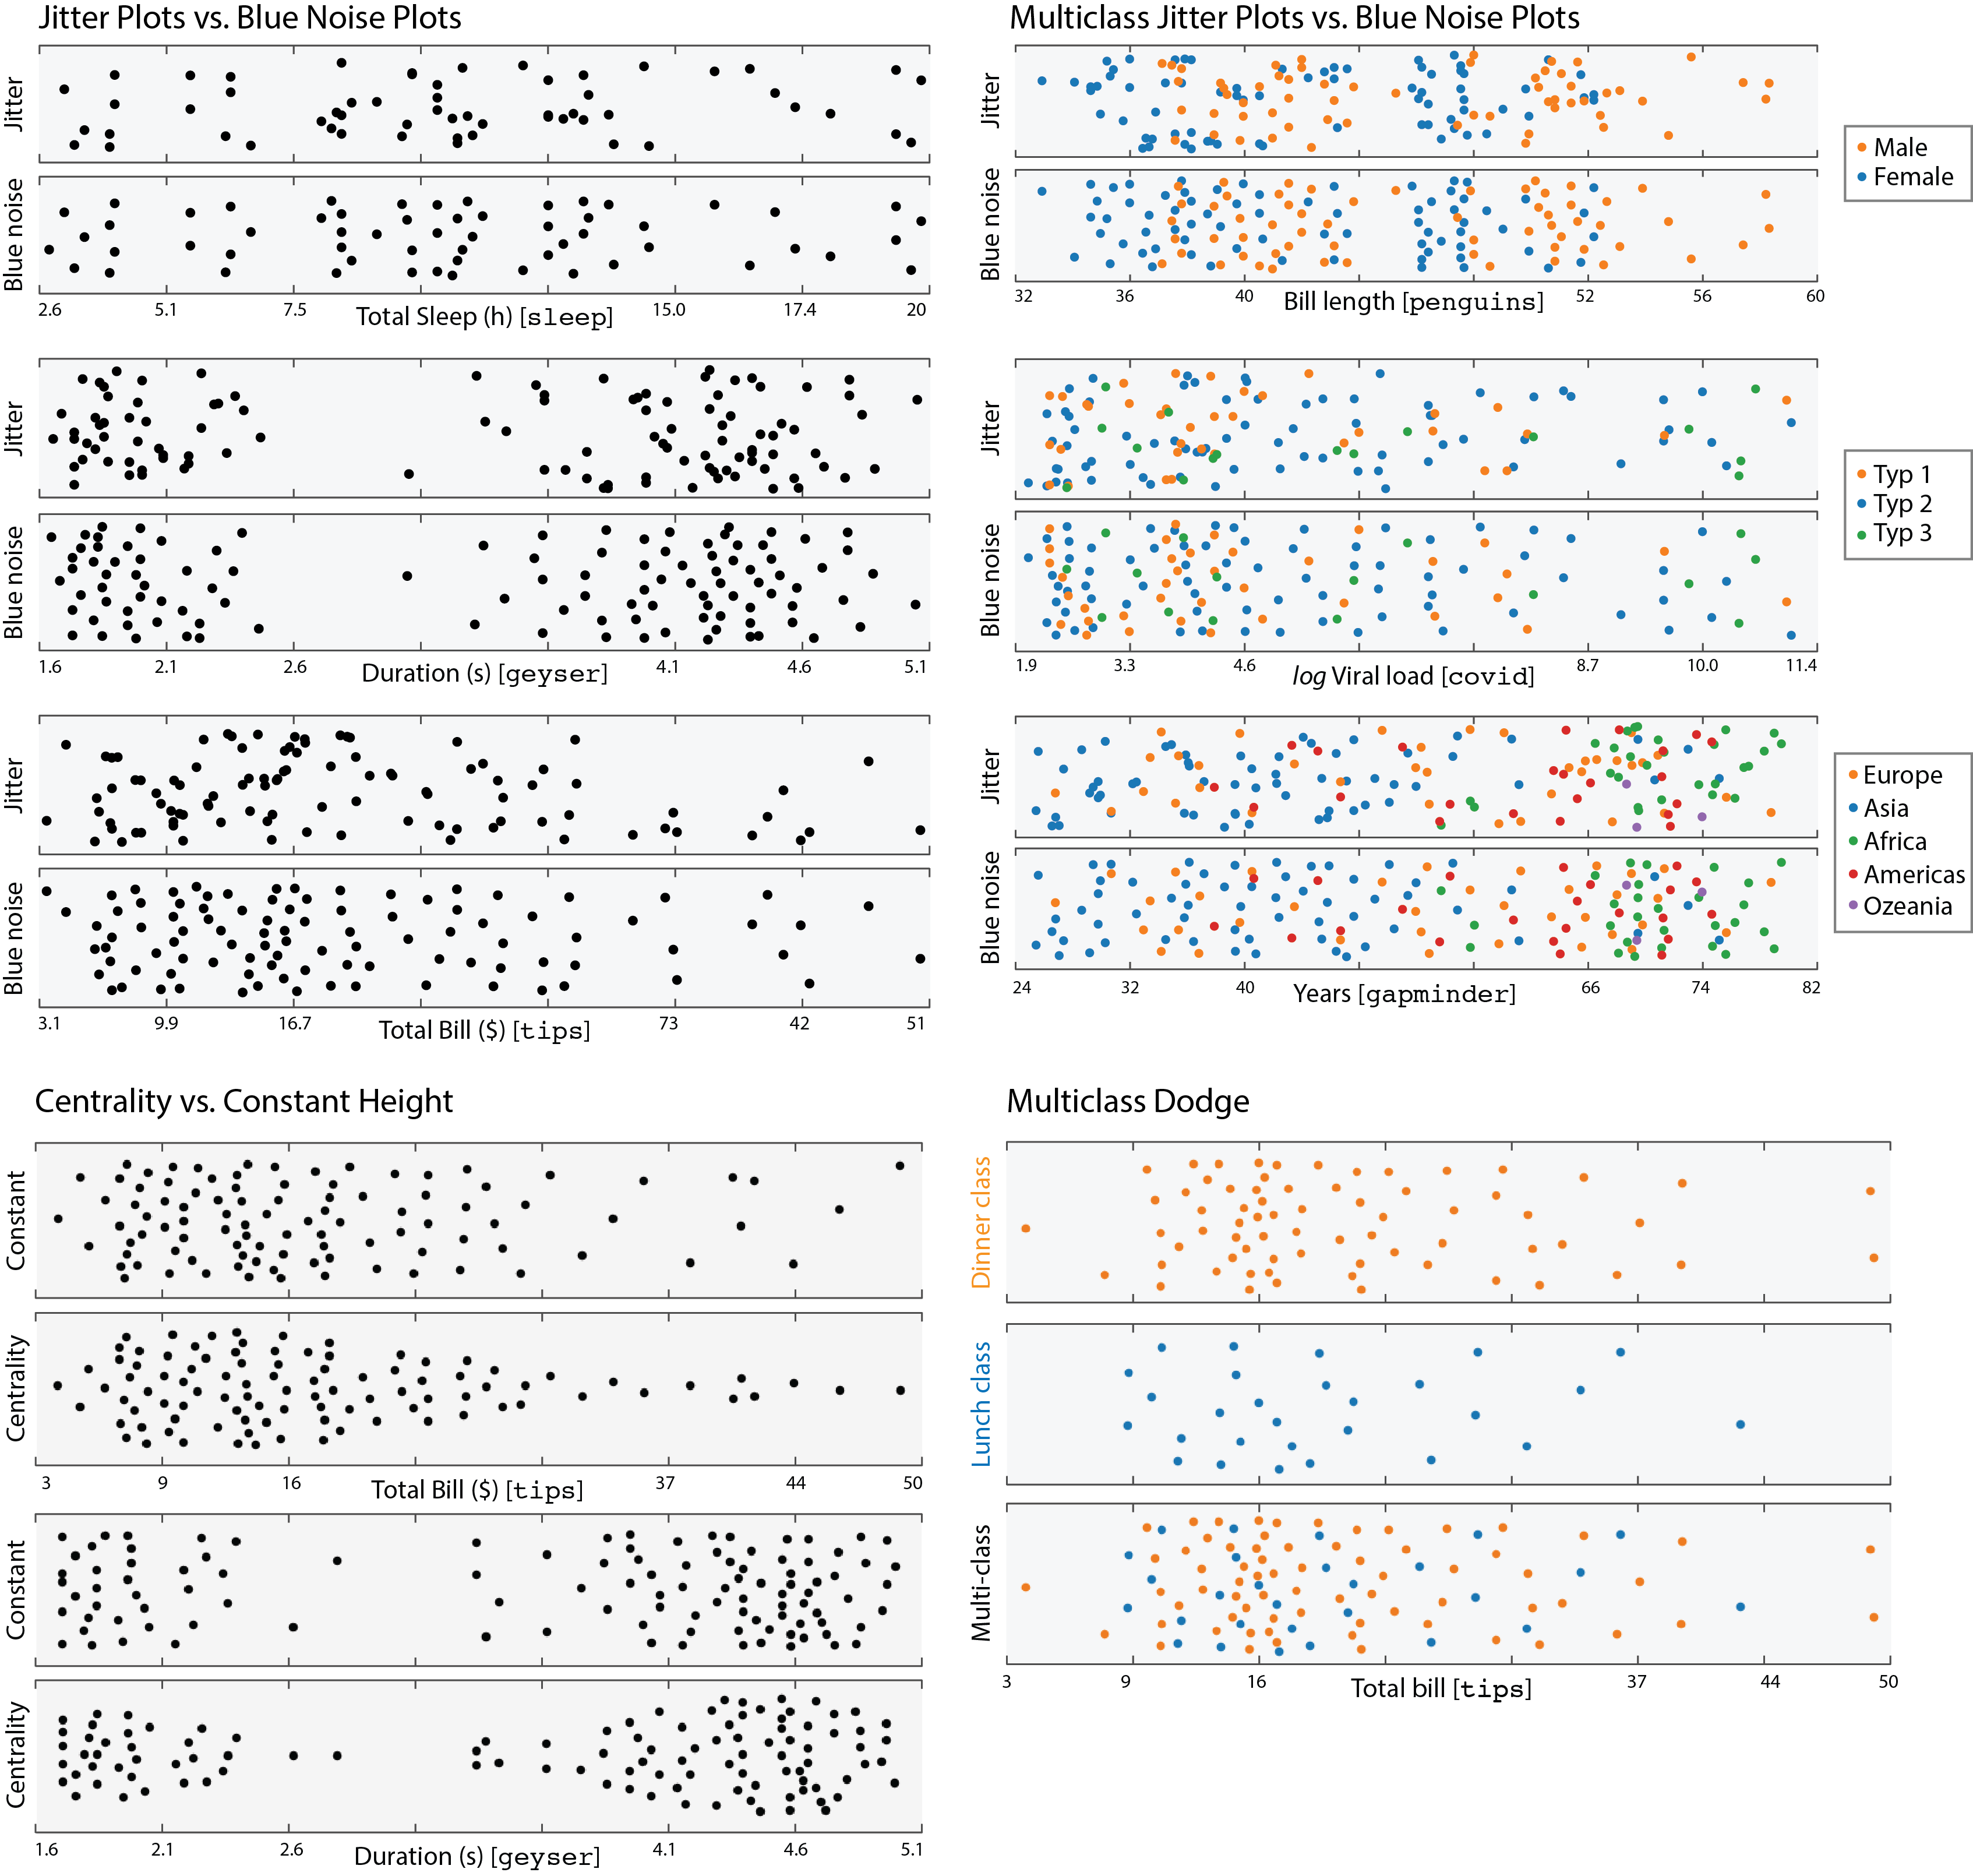
Python implementation of Blue Noise Plots, a novel replacement for jitter plots, published at Eurographics 2021.
C. van Onzenoodt, G. Singh, T. Ropinski, and T. Ritschel
This implementation uses tensorflow to enable hardware acceleration on supported platforms (Linux and Windows). Therefore, Blue Noise Plots are currently limited by prerequisites of tensorflow:
- Python 3.5–3.8
- Ubuntu 16.04 or later
- Windows 7 or later
- macOS 10.12.6 (Sierra) or later (no GPU support)
cd BlueNoisePlots
pip install -r requirements.txt
import pandas as pd
from blue_noise_plot import blue_noise

# Load data
mpg_filename = 'csv_data/auto-mpg.data'
column_names = ['mpg', 'cylinders', 'displacement', 'horsepower', 'weight',
                'acceleration', 'year', 'origin', 'name']
mpg = pd.read_csv(mpg_filename, delim_whitespace=True, names=column_names)
subset = mpg[mpg['cylinders'].isin([4, 6, 8])]


# Blue noise plot of `subset`, using our automatic width computation
points = blue_noise(x='mpg', data=subset, orient='h')
print('Num Classes: ', len(points))   # Num Classes:  1
print('Num Points: ', len(points[0])) # Num Points:  391

points = blue_noise(x='mpg', hue='cylinders', data=subset, orient='h')
print('Num Classes: ', len(points))   # Num Classes:  3
print('Num Points: ', len(points[0])) # Num Points:  204
print('Num Points: ', len(points[1])) # Num Points:  103
print('Num Points: ', len(points[2])) # Num Points:  84

points = blue_noise(x='mpg', hue='cylinders', data=subset, orient='h')

# Blue noise plot of `subset`, using predefined width.
points = blue_noise(x='mpg', hue='cylinders', data=subset, orient='h', plot_width=0.3)

# Render png of the distribution
blue_noise(x='mpg', hue='cylinders', data=subset, orient='h', size=20,
filename='mpg-blue_noise_plot.png')# Centralized Blue Noise Plot (see Examples below)
blue_noise(x='mpg', hue='cylinders', data=subset, centralized=True,
orient='h', size=20, filename='mpg-blue_noise_plot.png')
# Dodged Blue Noise Plot (see Examples below)
blue_noise(x='mpg', hue='cylinders', data=subset, dodge=True,
orient='h', size=20, filename='mpg-blue_noise_plot.png')To generate the examples, run the following:
cd examples
pip install -r requirements.txt
./example_plots.py
