-
Notifications
You must be signed in to change notification settings - Fork 1
Survey 3 2014 Jul 04
- DataFAQs/LOD Cloud provides an alternative (and less complete) overview.
- Apr 2013, Survey 0 ran an epoch for 338 lodcloud group datasets.
- Jun 2013, Survey 1 ran epochs for 337 lodcloud group and 902 tagged 'lod' datasets.
- Jun 2013, Survey 2 ran an epoch for 900 tagged 'lod' datasets.
- Feb 2014, IPAW 2014 The State of the Linked PROV Cloud uses a custom retrieval trigger (instead of doing a DataFAQs epoch) to find PROV terms in OpenLink's LOD Cache SPARQL endpoint.
- Apr 2014, Wave of Arrivals ran epochs for lodcloud group datasets and for tagged 'lod' datasets to produce the bar chart at http://lodcloud.tw.rpi.edu/lodcloud-wave-of-arrivals.

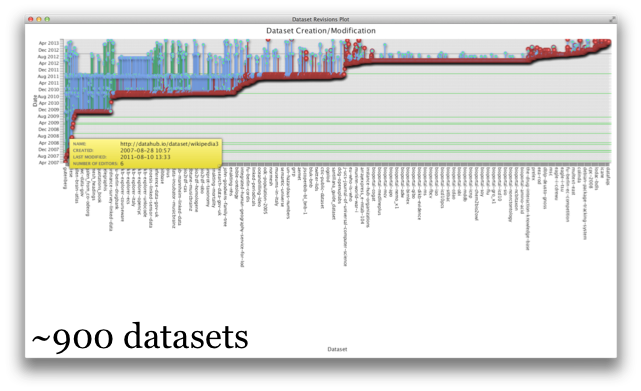
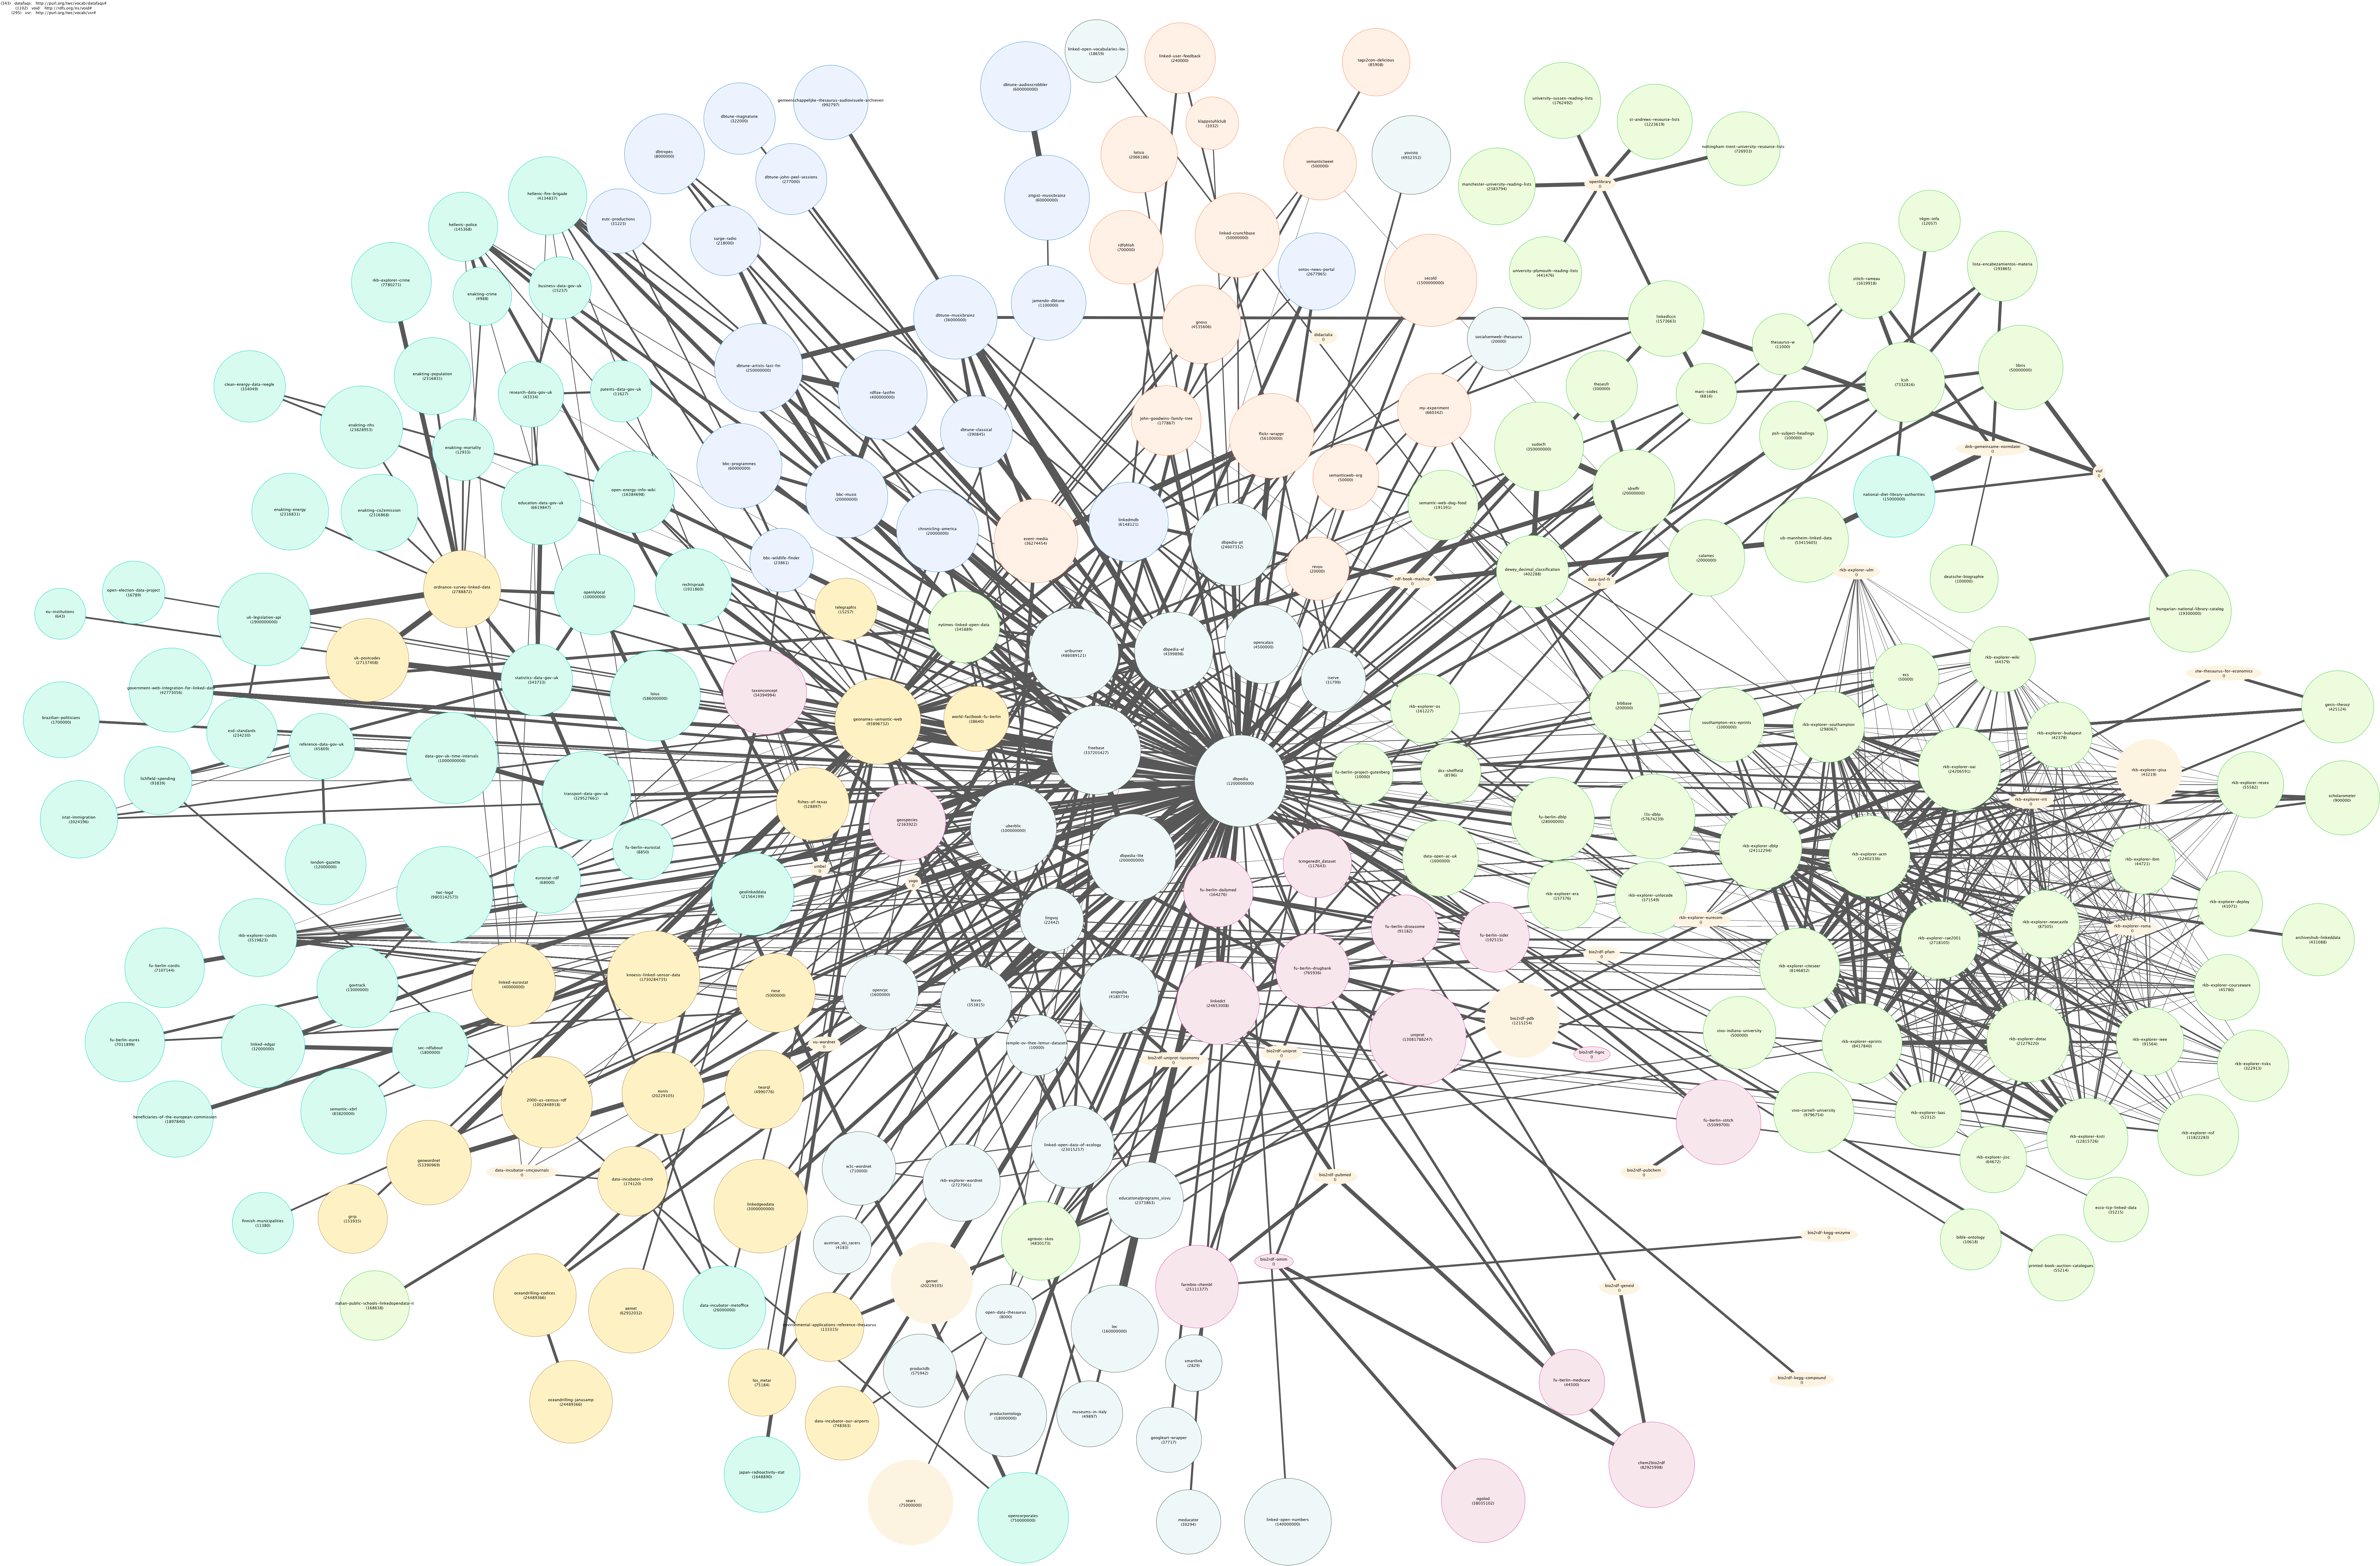
This page describes how we recreated The Linking Open Data cloud diagram from scratch for the those datasets already in lodcloud group. We go further to visualize the full 900 tagged 'lod' datasets and analyzing the edit history of the datahub.io entries for each of the datasets.
-
The ~300 lodcloud group is based out of source/datahub-io/lodcloud-group/version/faqt-brick
- We've been inconsistent with choosing the conversion:source_identifier in the past.
- The 2013-04-14 data/faqs/lifted-ckan, run by
me@laptop, didn't require a source identifier, since it was done before we designed how to Situate a FAqT Brick. We adopted its configuration for the current home at datahub-io/lodcloud-group (with this commit) into its current "datahub-io" source. - The 2013-06-04 us/how-o-is-lod, run by
lodcloud@datafaqstest, does the same analysis. - It could have also been lodcloud since really the data is coming from "everywhere" including ourselves, but most of the dataset listings come from datahub.io and most datasets don't provide good metadata about themselves (so, this time we chose datahub-io).
- The 2013-04-14 data/faqs/lifted-ckan, run by
- Run and published as
lodcloud@lodcloud - A first epoch was run on 2014-07-04, but after some inspection and issues documented on [the datasets's wiki page](Dataset datahub io lodcloud group), we ran a second epoch on 2014-07-06 to fix some of the completeness issues.
- We've been inconsistent with choosing the conversion:source_identifier in the past.
-
The ~900 lod tag is based out of source/datahub-io/lod-tag/version/faqt-brick
- Previous runs of this kind of epoch:
- The
2013-06-22from us/lod-tag was run bylodcloud@datafaqstest - The 2014-04-07 from us/lod-tag was run by
lodcloud@lodcloud, but isn't in version control.
- The
-
2014-07-07 run and published by
lodcloud@lodcloud.
- Previous runs of this kind of epoch:
Used cache-queries.sh in data/source/us/the-living-lod-cloud/version/2014-Jul-05/retrieve.sh.
We recovered lodcloud-diagram.rq from the "2013-Apr-15 effort".
TODO:
- We should fill in the originally-intended tie to http://datahub.io/dataset/the-living-lod-cloud
We can gob on the RDF from Survey 1 2013 Jun 22 methods to change the view of the lodcloud diagram.
TODO:
- fix of the conversion to include those about datasets in the 2011 lodcloud diagram.
- CONSTRUCT from the survey dataset, UNION into the-living-lodcloud that goes into VSR.
- modify linksets.vsr to blacklist/color according to the new characteristics (responded, new diagram yes/no, etc).
datahub-io/dataset-entry-revisions caches two queries for the dataset entry revisions (e.g. that of nomenclator-asturias. One query for the ~300 lodcloud-group datasets, another for ~900 lod-tag datasets.
We recovered dataset-revisions.rq from the "2013-Apr-15 effort" to here, so that it has it's own proper dataset. Note that it only shows the 264 lodcloud group datasets; we'd need to run a datafaqs epoch against the full 900 tagged to get that one.

It would be really nice to reimplement this using VSR...
TODO:
- Pass the-living-lod-cloud's CONSTRUCT through edu.rpi.tw.visualization.graph.layout.centrifuge.Centrifuge
- Pass ^ through spo-balance:Tablizer.java to get vsr:row and vsr:col.
- Pass ^ through linksets.vsr to scale vsr:row/vsr:col by a fixed constant (IF a previous x,y is not given).
An alternative to Centrifuge is to plot the datasets into a radial, where the angle is a function of the void:uriSpace (inspired from our BTC analysis) and the radius is proportional to the inverse of the dataset entry creation date.
