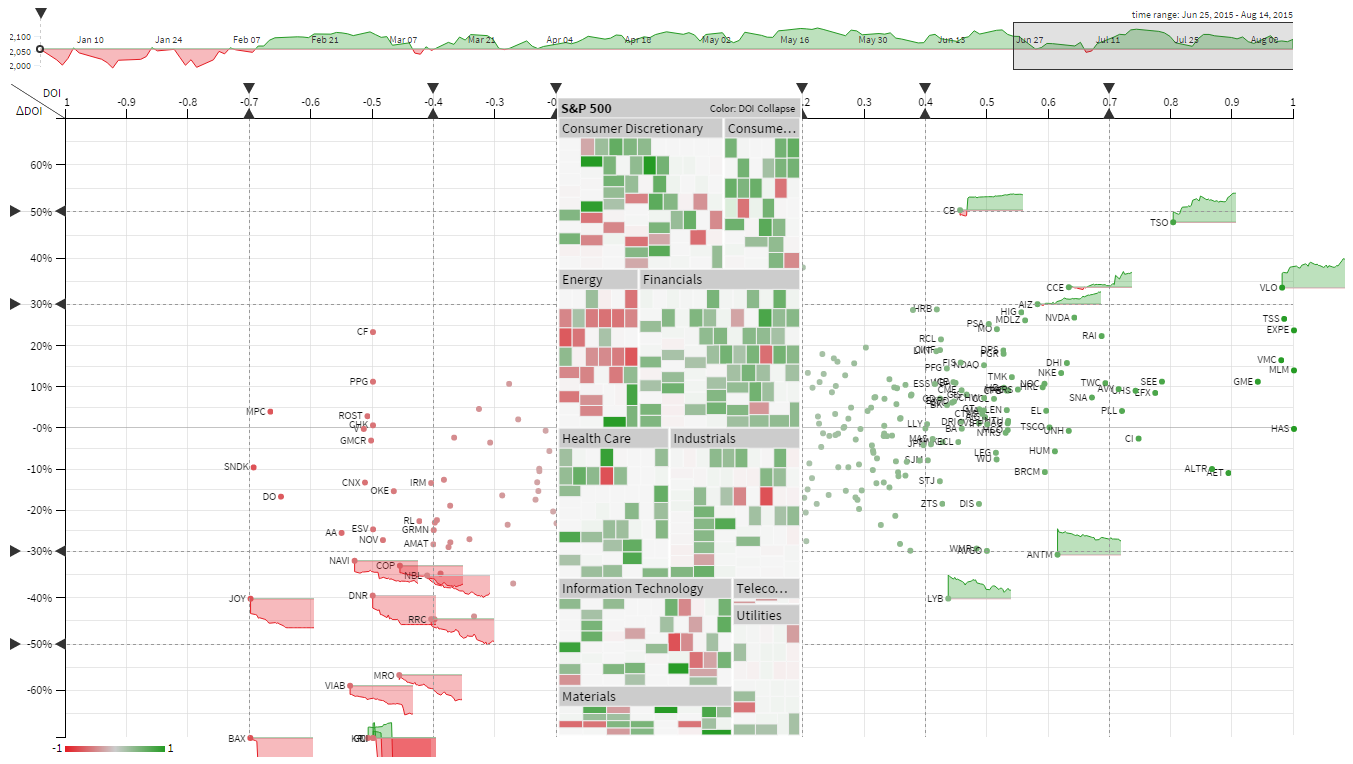
ThermalPlot is a technique to visualize multi-attribute time-series data using a thermal metaphor.
- Install Git Large File Storage before cloning this repository
git clone https://github.com/thinkh/thermalplot.gitnpm install
Open your terminal or command line and run npm start.
- Clone this repository
- Open your terminal or command line
- Create frontend build:
npm run build - Run
docker build -t thermalplot:latest .
- Open your terminal or command line
- Run
docker run -d --rm -p 80:3000 --name tpc thermalplot - Open a web browser and go to http://localhost
- Switch to the terminal or command line
- Run
docker stop tpc
