-
Notifications
You must be signed in to change notification settings - Fork 11
Profile and Trace an Application
As traces might get large, I recommend to first profile you application, and to create a filter file. For some use cases, profiling might even be sufficient.
First, you need to profile your application using the python bindings you have just installed. To do so simply let the scorep python module execute your Application:
python3 -m scorep yout_app.py
From the test sets, you can for example use the test_sleep.py:
cd test/
python3 -m scorep test_sleep.py
This will create a Folder in the same directory, which is named like:
scorep-20180514_1012_10320848076853/
You might have realised that the current day as well as the time at, which you run the experiment is encoded in this name. You can change the name of the directory by specifying SCOREP_EXPERIMENT_DIRECTORY:
export SCOREP_EXPERIMENT_DIRECTORY=test_dir
python3 -m scorep test_sleep.py
This will create a directory called test_dir
The folder, which you just created, contains now different files like:
profile.cubex
scorep.cfg
scorep.fgp
The profile is saved in profile.cubex. If you have cube installed you can do:
cube test_dir/profile.cubex
This will show you the following picture:

As you can see, we have a function, that just does some pointless sleeping 😄 .
Now we are able to fix this. Just change the code, as done in test_nosleep.py.
Profiling will deliver the following picture:

Finally, you can trace you application as well. To do so you need to export SCOREP_ENABLE_TRACING=true. Your code might look like:
export SCOREP_EXPERIMENT_DIRECTORY=test_dir
export SCOREP_ENABLE_TRACING=true
export SCOREP_TOTAL_MEMORY=3G
python3 -m scorep test_sleep.py
Now your experiment directory test_dir should look like:
profile.cubex
scorep.cfg
scorep.fgp
traces/
traces.def
traces.otf2
…
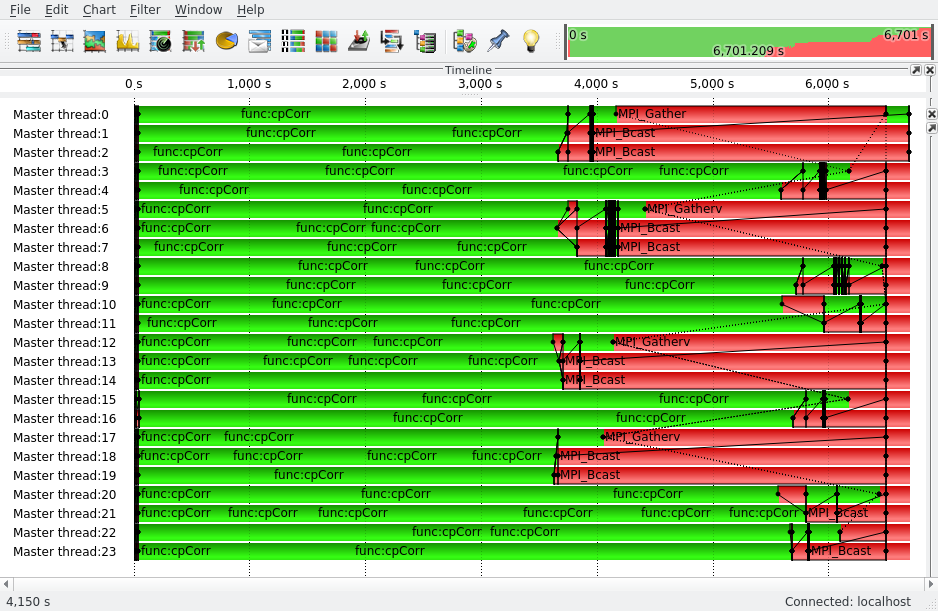
To visualise OTF2 files you can use Vampir. Vampir is a commercial product, but you can retrieve a demo license from vampir.eu
If you visualise your trace using Vampir you end up with the following picture:

This looks quite simple, but once you have a parallel MPI application this insight becomes quite helpful, like in the picture below:
