Wiretap is a unique real-time portable C++ profiler. It is made of two parts: Wiretap Profiler and Wiretap Viewer.
The Wiretap Profiler is an API used to capture profile timings in a program and stream that data to Wiretap Viewer. It is extremely simple to integrate (see below).
The Wiretap Viewer is a graphical application that displays in real-time profile timings and information streamed from Wiretap Profiler and can also pause, rewind and step captures.
There are just 2 calls to make in order to capture and stream profile timings to the viewer.
- PROFILE_SCOPE(something); declares a profile point. When the program leaves the scope (function or unnamed scope) the execution timing is saved.
- Wiretap::Profiler::SendData(); simply streams to the viewer all the events that have been captured until then and clears these events. It must be placed outside any PROFILE_SCOPE to get accurate timings (we don't want to add to the timings the time spent streaming the data).
#include "WiretapProfiler.h"

// ...
	while (true)
	{
		Update();

		Wiretap::Profiler::SendData();
	}
// ...

void Update()
{
	PROFILE_SCOPE(Update);
	SomeFunction();
	SomeOtherFunction();
	// ...
}

void SomeFunction()
{
	// ...
	// Some code ...

	// Unnamed scope can be profiled
	{
		PROFILE_SCOPE(Update);
		// Some more code ...
	}
}The viewer gets its data from the profiler over the network and works locally or remotely. You can for example profile an application running on a raspberry pi and run the viewer on a PC.
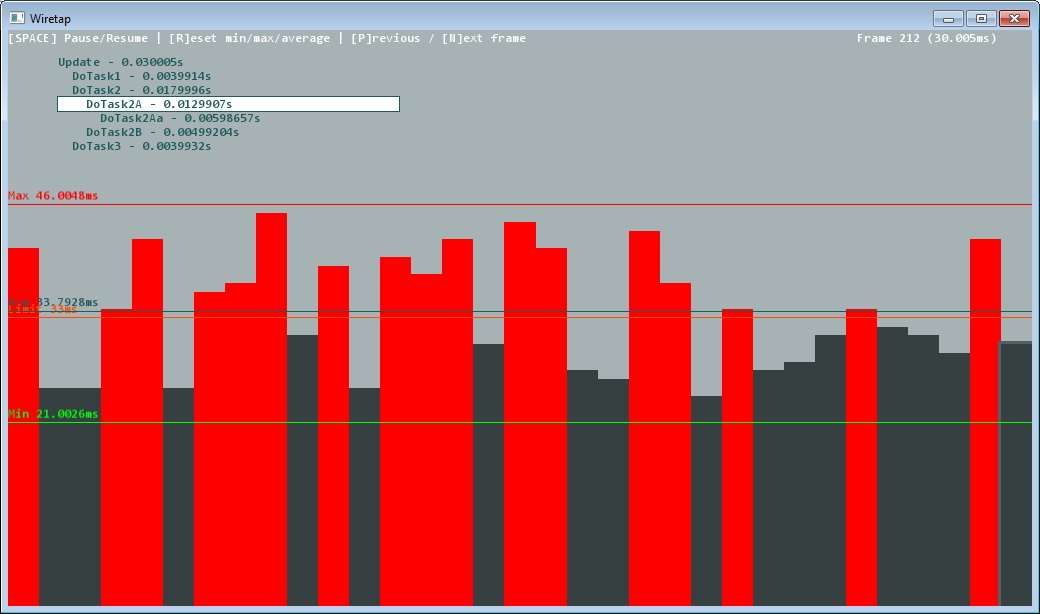
It has a unique way of displaying the timed information: it is frame-oriented, each frame (of a game, of a media player, of an application's main update function) is represented by a vertical bar. The frames scroll from right to left and their height represents their duration.
If a frame is longer than a user-defined threshold, it will be displayed in red.
Several lines represent the maximum, minimum and average frame duration for the visible time period (1 second by default), as well as the threshold duration in the middle of the screen.
Each captured profile point (function call, unnamed scope) is displayed on the left side of the screen in a hiearachical way with its own duration. These points can be expanded or collapsed with the arrow keys [not implemented yet].
Everything updates in real-time but it's possible to pause the display (press spacebar) (data is still being captured) and rewind and step over the frames to take the time to inspect them by pressing [n]ext or [p]revious. The selected frame is outlined in gray.
Wiretap Profiler and Wiretap Viewer are based on the SFML library and currently developped on Windows 7 with support for Visual Studio 2008 and 2012. The choice of this library is to make it portable easily. Linux/unix makefile soon.
There are many more features planned including profiling for other languages, see TODO.
You can also check the FAQ or send me an email.
Romain Dura
