-
Notifications
You must be signed in to change notification settings - Fork 12
Home
You'll need a git client, Python, and a couple Python packages. On an Ubuntu Linux system, this is quickly accomplished by running:
sudo apt-get install git python python-matplotlib python-numpy python-scipy
On other operating systems, using easy_install is a good tool for getting Python packages. Install easy_install, then use it to get numpy, scipy, and matplotlib.
For development, python 2.7.3, scipy 0.9.0, numpy 1.6.1, and matplotlib 1.1.1rc are used.
Now, grab the current development snapshot by running:
git clone https://github.com/matted/multipool.git
You could also skip the git step by downloading the current version of mp_inference.py directly from the web interface.
You can also download the code and example data as a zip from github by downloading https://github.com/matted/multipool/archive/master.zip.
You should be able to run Multipool and see the input options by running:
python mp_inference.py -h
The core input data for Multipool is allele counts across regions of the genome. We use a simple text format where each line is a locus with a position, count in one strain, and a count in the other strain. Typically, a separate input file is generated and processed for each chromosome.
For example:
18698 38 50
19079 38 37
19190 37 34
19235 28 41
19418 45 18
19592 42 47
19607 37 53
Concretely, each position may be a SNP and the last two columns indicate how many reads measured each of the two alleles. The alleles should be phased so that the middle column always denotes counts from one strain and the last column always denotes counts from the other strain.
There are many ways to generate these counts from sequencing data. A common way is to identify a list of segregating SNPs by other experiments, and look at those positions in an aligned BAM file with samtools mpileup. Currently, input file generation is delegated to external tools or scripts, but in the future this functionality will be pulled into Multipool more directly.
A key issue is input data accuracy: as best as possible, the counts should not be polluted with false SNPs (non-segregating sites) or markers that are particularly troublesome due to mapping or other issues. Multipool's information-sharing approach can alleviate some of the problems of noisy markers, but external pre-filtering will always help.
Here are some quick usage examples based on the example files included in the software distribution. The only required parameter is the number of individuals in each pool. The recombination rate is set to the average in yeast by default.
-
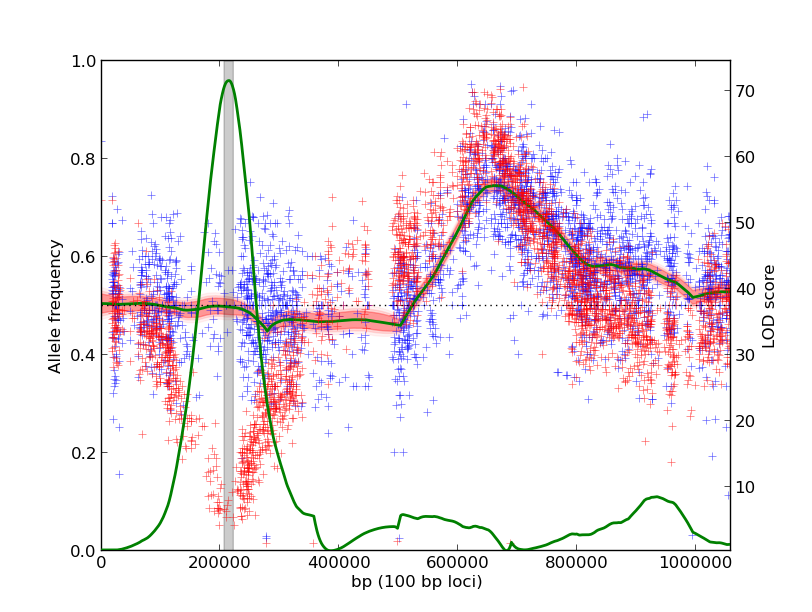
Compare two experiments for significant differences. Here, the null hypothesis is that the underlying allele frequencies across the genome are the same. Departures from this assumption are scored for significance. This is useful for comparing a selection against a null experiment or opposite phenotypic extremes.
./mp_inference.py -n 1000 poolK1_chr12.txt poolK2_chr12.txt -m contrast
The output plot identifies a locus on the left arm of the chromosome that is different in the two experiments:
-
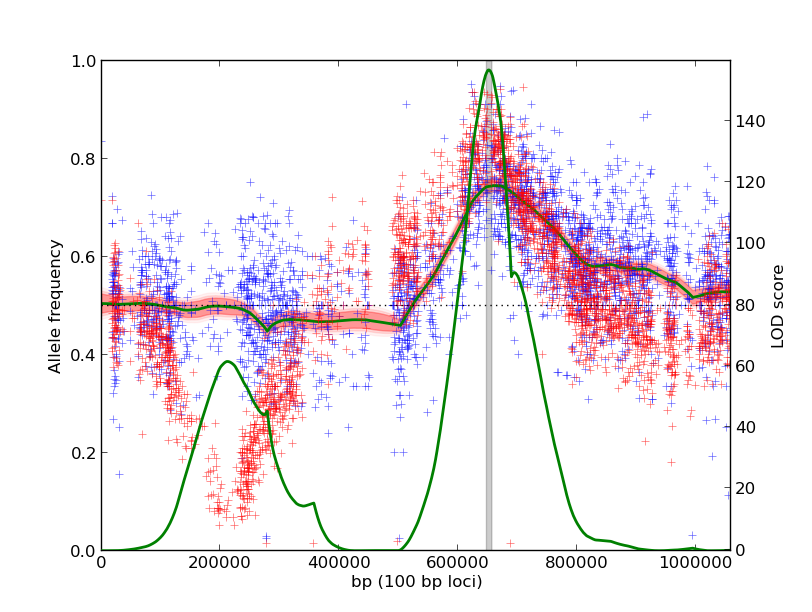
Leverage multiple experiments as biological replicates. Here, the null hypothesis is that the underlying allele frequencies across the genome are 50%, suggesting no correlation with the phenotype. The alternate hypothesis is that the replicate experiments have the same, non-50%, allele frequency. Likelihood ratios comparing these hypotheses are computed across the genome.
./mp_inference.py -n 1000 poolK1_chr12.txt poolK2_chr12.txt -m replicates
Using the same input data as the first example, we identify a shared QTL on the right arm of the chromosome. The QTL on the left arm is not as significant because the two experiments have dramatically different underlying allele frequencies.
The command line output will print several credible intervals for the causal locus, as well as a single point estimate of its location. If the -o option is included, full output for each genomic bin will be written to that file. This is a tab-delimited three-column format with the first row labeling the columns.
Bin start (bp)  MLE allele freq.        LOD score
0       0.4875  0.52
100     0.4875  0.52
200     0.4875  0.52
300     0.4875  0.52
400     0.4875  0.52
...
218300  0.0775  71.24
218400  0.0775  71.22
218500  0.0775  71.20
218600  0.0775  71.17
218700  0.0800  71.15
The output plots visualize the raw count data along with the estimated model parameters. The red and blue plus marks are raw measurements from individual markers, reported in the input data. Each input experiment is a different color. The shaded red region is a credible interval around the posterior distribution of the true allele frequency. The green line is the LOD score along the genome, with scale on the right axis. The gray bar shades the 90% credible interval around the QTL peak.
When interpreting the results, a careful consideration of the modeling assumptions is necessary. From current experience, the following assumptions are the most important:
- Uniform recombination rate across the genome, and in particular, equal (symmetic) around a QTL peak
- Uncorrelated errors in allele frequency noise
- Equal DNA representation from each member of the pool in the sequenced library
- Relatively accurate allele frequency calls for the input count data
Current work is aimed at reducing the dependence on these assumptions. One hedge is to reduce the pool size when computing peak intervals, since this approximately reflects the additional noise from e.g. pooling heterogeneity.
- How can I learn more about the details and motivations behind Multipool?
For now, the best bet is to read the paper. As this wiki grows, it will become a better resource for this task.
- Can Multipool find and report multiple QTLs?
Currently, no. The assumptions of the model require that only a single causal locus be active in the analyzed region. Regions with multiple apparent QTLs should be analyzed separately (that is, the count data files should be split). In practice, multiple QTLs would only cause Multipool problems if they were so close as to be linked and distort the decay of the allele frequencies back to the expected 50% away from a QTL.
- How do I report a bug in the software or request a clarification in usage?
The quickest way currently is to email Matt Edwards. You can also add an issue through Github, which I'll use to track feature requests and bug reports.

