monitoring-nginx-proxy-companion is a lightweight companion container for the nginx-proxy.
If you are already using docker-compose for your nginx-proxy setup you need to add two services shown below to it.
Be sure to have the correct user-defined network set and adapt PROXY_CONTAINER_NAME to your proxy's container
name. (the full docker-compose.yml can be found in the root of this repository)
monitoring-nginx-proxy-companion:
    image: lukaskroepfl/monitoring-nginx-proxy-companion
    depends_on:INFLUX_URL
      - monitoring-influx-db
      - nginx-proxy
    restart: always
    container_name: monitoring-nginx-proxy-companion
    environment:
      - PROXY_CONTAINER_NAME=nginx-proxy
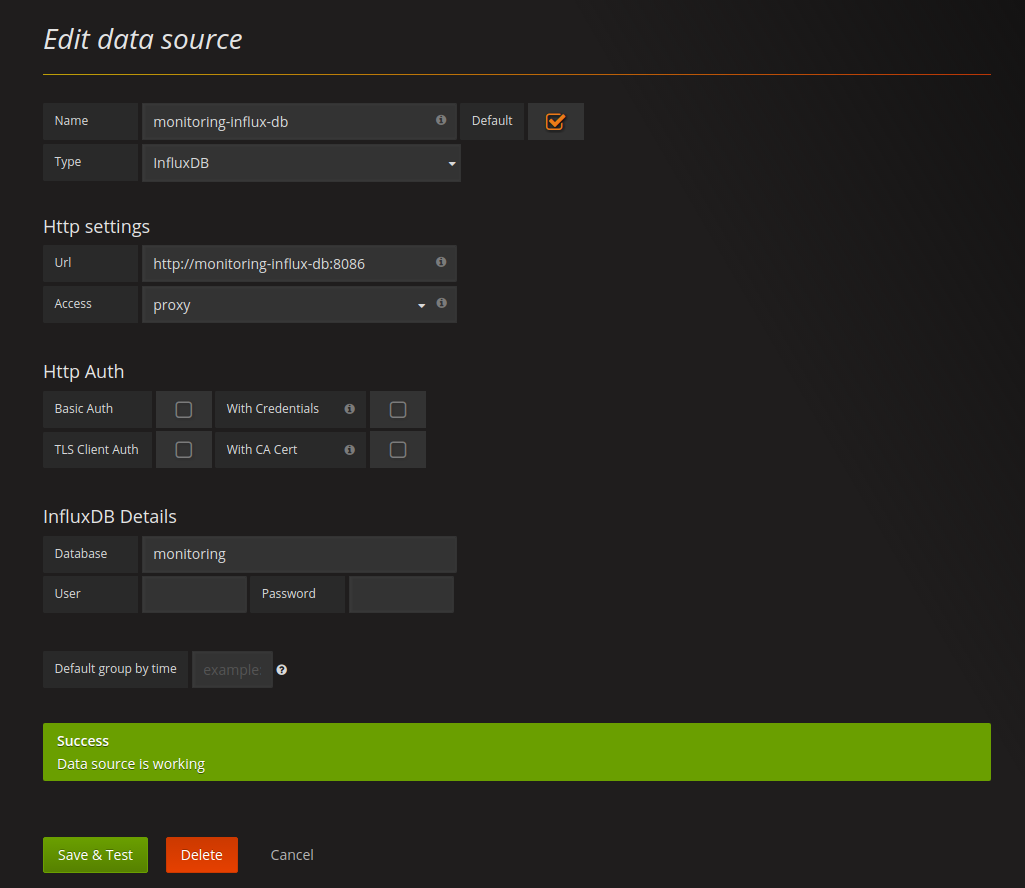
      - INFLUX_URL=http://monitoring-influx-db:8086
      - INFLUX_DB_NAME=monitoring
    volumes:
      - /var/run/docker.sock:/var/run/docker.sock:ro
    networks:
      - proxy-tier

  monitoring-influx-db:
    image: influxdb:alpine
    restart: always
    container_name: monitoring-influx-db
    volumes:
      - "~/monitoring-influx-db/data:/var/lib/influxdb"
    networks:
      - proxy-tier

    monitoring-grafana:
      image: grafana/grafana
      restart: always
      container_name: monitoring-grafana
      ports:
        - "3000:3000"
      environment:
        - GF_SERVER_ROOT_URL=http://your_host
        - GF_SECURITY_ADMIN_PASSWORD=your_password
      networks:
        - proxy-tier
The monitoring-nginx-proxy-companion creates a influxdb database on startup with the name set by INFLUX_DB_NAME if necessary.
docker-compose up -d
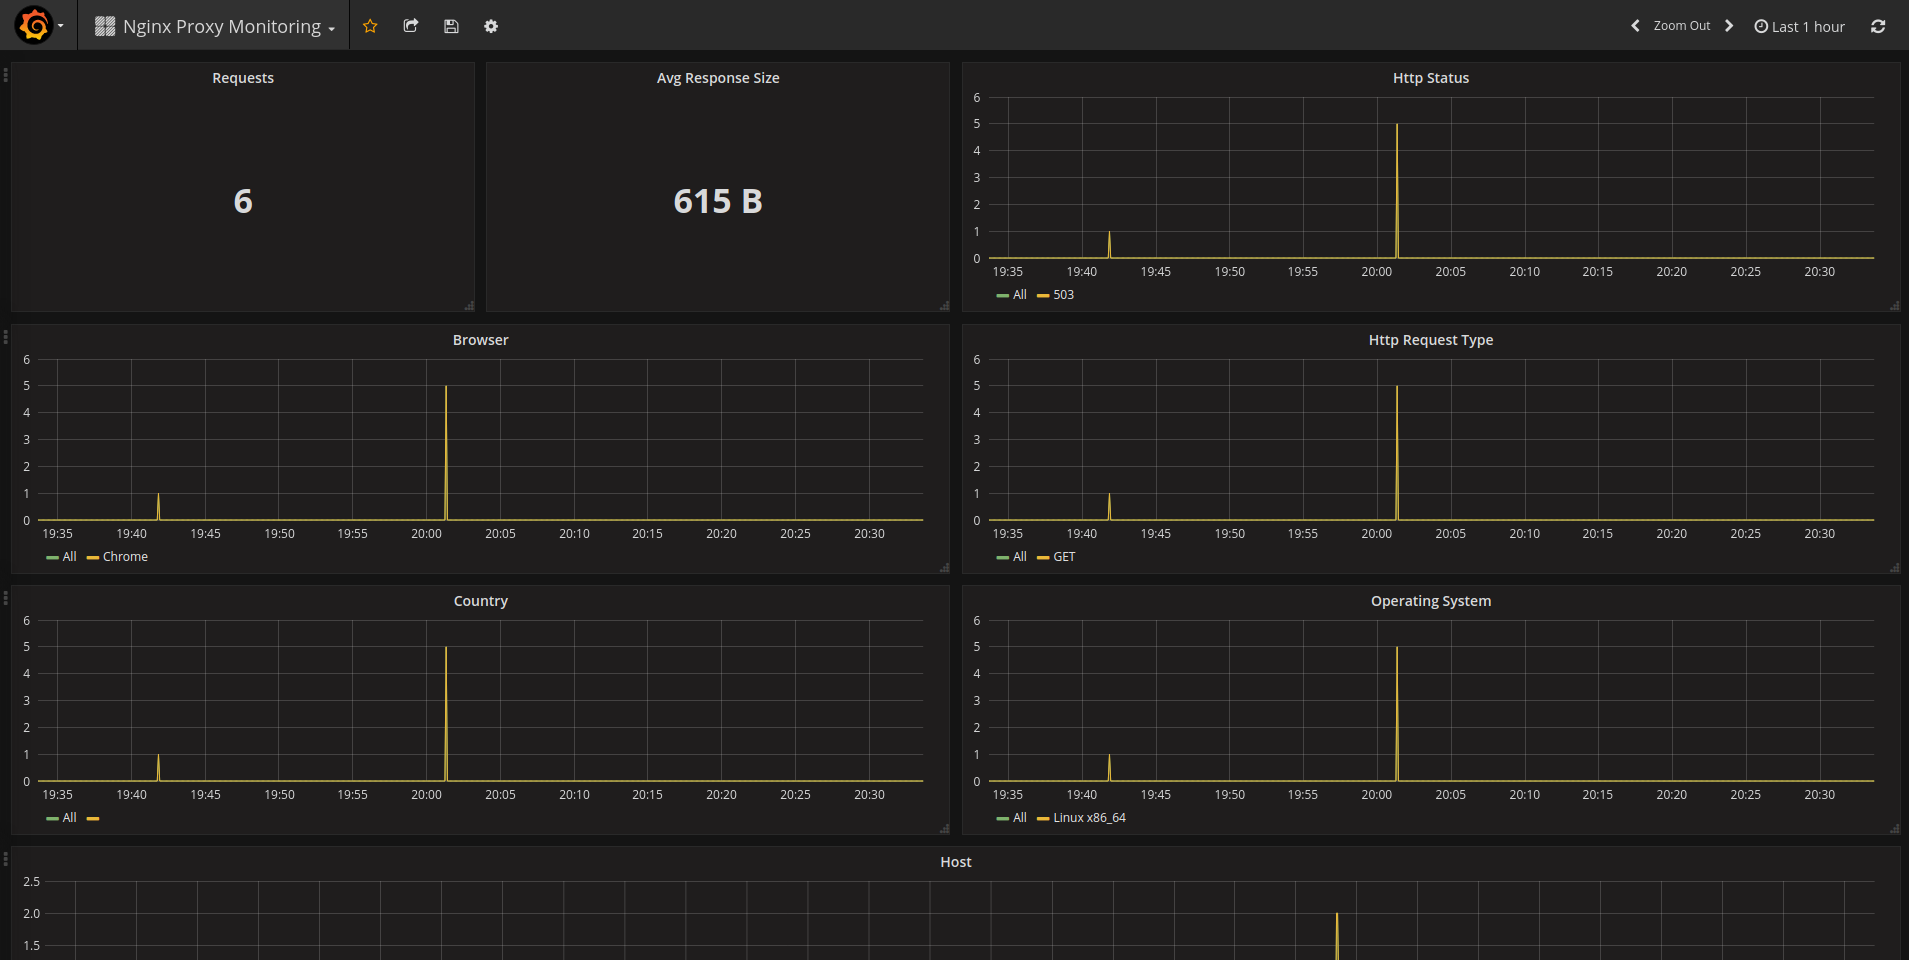
You can simply import the dashboard I created by importing following json.
https://raw.githubusercontent.com/lukaskroepfl/monitoring-nginx-proxy-companion/master/grafana-dashboard.json


