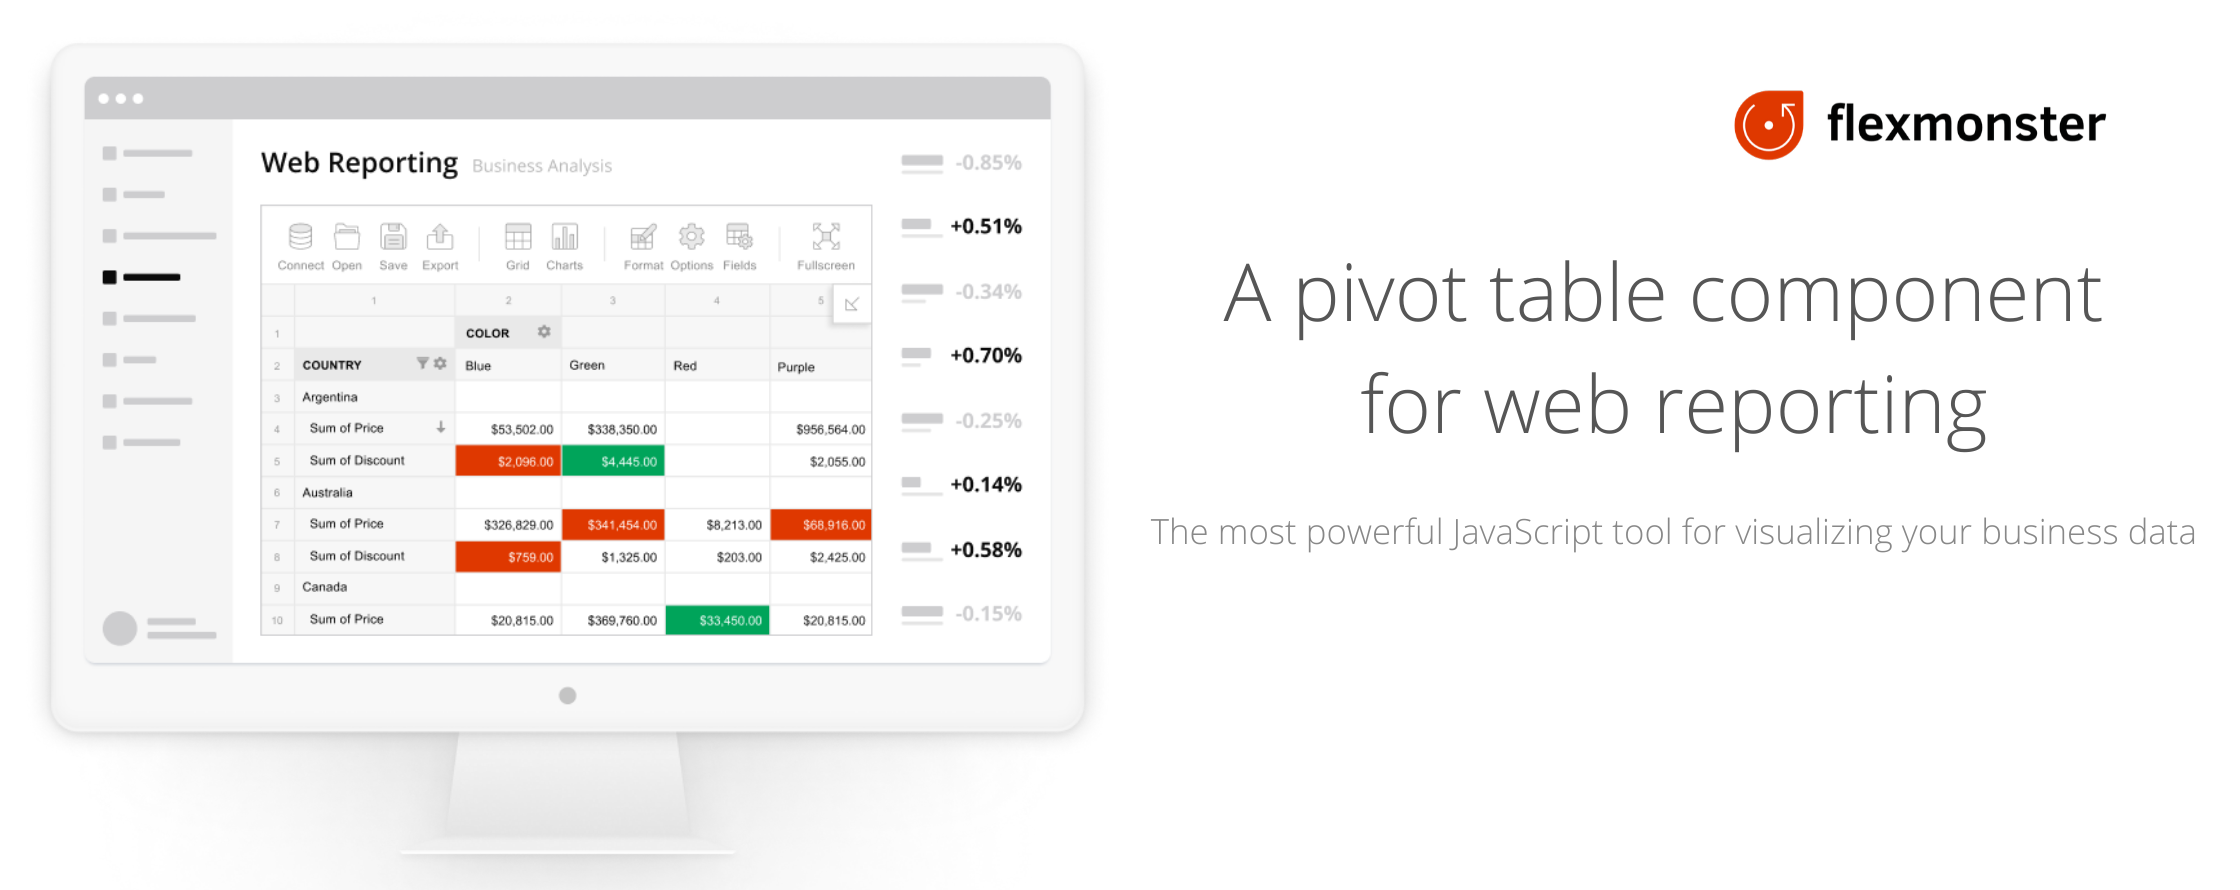
Flexmonster Pivot Table & Charts is a powerful JavaScript library for visualizing and analyzing data in your web application. It includes all core reporting features and can process large data volumes.
You can use Flexmonster Pivot Table & Charts in any environment where JavaScript can be run. For the most popular technologies and client-side frameworks, such as React, Angular, and Vue, ready-to-use integrations are provided. Check them out in our integration section.
- JSON
- CSV
- SQL databases
- And many others
Visit our docs for the full list of supported data sources.
- Filtering
- Sorting
- Grouping fields
- Drill-through view
- Calculated values
- Conditional formatting
See all available features for data analysis.
Make Flexmonster look native to your project with the following personalization options:
- CSS themes — enhance the component’s look and feel with our ready-to-use themes or make a custom one.
- Language localization — use our predefined localization files or create your own to translate Flexmonster into any language.
- Extensive API — tailor data visualization to your needs by adding your custom UI controls and views.
Discover even more customization options in our documentation.
Your reporting results can be saved as a JSON file or exported to various formats, including PDF, CSV, and Excel.
Follow the integration guide to embed Flexmonster in your application.
Learn more about Flexmonster Pivot Table & Charts on our website:
To share your feedback or ask questions, contact our Tech team by raising a ticket on Flexmonster Help Center. You can also find links to helpful pages about Flexmonster there.
Visit our pricing page to learn about Flexmonster licensing options. If you want to test our product, we provide a 30-day free trial.
Should you need any help with your license — fill out our Contact form, and we will get in touch with you.
Follow us on social media and stay updated on our development process!


