-
Notifications
You must be signed in to change notification settings - Fork 53
How to use the Camel Debugger
Textual debug for Camel routes also called Camel Debugger allows to set breakpoints at Route definition.
This article will explain how it is possible to use it with the IntelliJ plugin and what are its limitations.
- IntelliJ with Apache Camel IDEA Plugin 0.8.13+ installed
- Maven available on the system path
- Java 11+ installed
- Camel 3.15+, recommended version 3.18+
On any type of file supported by the plugin (currently Java, XML, and YAML) in which you define your routes, you can simply click on the margin in front of the line where you want to set your breakpoint in a given route. A red dot then appears in the margin indicating that the breaking point has been added with success.
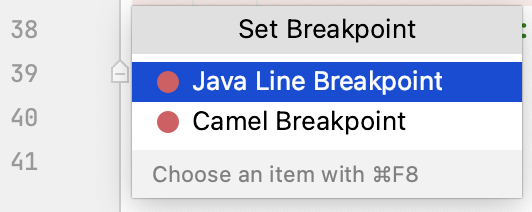
In the case of a route defined in a Java class, when you click on the margin, IntelliJ proposes 2 types of breakpoint which are Java Line Breakpoint and Camel Breakpoint as shown in the following screenshot:

The first one is a common Java Breakpoint that you can use for pure Java debugging while the second one is the special type of breakpoint supported by the Camel Debugger that you need to select.
Depending on the Camel runtime used, you may have additional configuration steps to do. Indeed, for now, the plugin only supports the Standalone/Main, Spring Boot, and Quarkus runtimes and for each supported runtime, a dedicated Camel Configuration is provided by the plugin.
For the sake of clarity, one dedicated sub-section is proposed per Camel Runtime / Launch mode (test or application) to better describe the configuration steps to do in each particular use case.
In the case of the Standalone/Main Runtime, there are two ways to launch a Camel application with the Camel Debugger enabled, either seamlessly using directly the Java Launcher or by adding a new Camel Application configuration.
- With the Java Launcher by clicking on the green arrow in front of the main method declaration or the declaration of the class holding the main method, then by selecting Debug as shown below:

- With a Camel Application configuration by clicking on the menu items Run / Edit Configurations..., then + (in the top left of the popup window) to add a new configuration then finally Camel Application to create a new Camel Application configuration based on a template. Most of the time, the default parameters are good enough so you can click OK, the configuration then appears as the selected Run/Debug Configuration such that you can simply click on the Debug button to launch the application with the Camel Debugger enabled as shown below:

In the case of the Standalone/Main Runtime, the only way to launch a test with the Camel Debugger enabled is seamlessly using directly the JUnit Launcher by clicking on the green arrow in front of the declaration of a specific test method or the declaration of the JUnit test class, then selecting Debug as shown below:

In the case of the Spring Boot Runtime, there are two ways to launch a Camel application with the Camel Debugger enabled, either seamlessly using directly the Java Launcher or by adding a new Camel SpringBoot Application configuration.
- With the Java Launcher by clicking on the green arrow in front of the main method declaration or the declaration of the class holding the main method, then selecting Debug as shown below:

- With a Camel SpringBoot Application configuration by clicking on the menu items Run / Edit Configurations..., then + (in the top left of the popup window) to add a new configuration then finally Camel SpringBoot Application to create a new Camel SpringBoot Application configuration based on a template. Most of the time, the default parameters are good enough so you can click OK, the configuration then appears as the selected Run/Debug Configuration such that you can simply click on the Debug button to launch the application with the Camel Debugger enabled as shown below:

In the case of the Spring Boot Runtime, the only way to launch a test with the Camel Debugger enabled is seamlessly using directly the JUnit Launcher by clicking on the green arrow in front of the declaration of a specific test method or the declaration of the JUnit test class, then selecting Debug as shown below:

In the case of the Quarkus Runtime, the only way to launch a Camel application with the Camel Debugger enabled is by adding a new Camel Quarkus Application configuration by clicking on the menu items Run / Edit Configurations..., then + (in the top left of the popup window) to add a new configuration then finally Camel Quarkus Application to create a new Camel Quarkus Application configuration based on a template. Most of the time, the default parameters are good enough so you can click OK, the configuration then appears as the selected Run/Debug Configuration such that you can simply click on the Debug button to launch the application with the Camel Debugger enabled as shown below:

Not yet supported