-
Notifications
You must be signed in to change notification settings - Fork 2
Home
- Introduction
- Project Structure
- Getting the code
- Getting DAVE™
- Work with Get Started project in DAVE™
- Code footprint
The project consist of the DAVE™ specific files and folders, and an integrated git submodule from the OPTIGA™ Trust X hostcode repository. This is a ready to work DAVE™ project prepared to demonstrate features of the OPTIGA™ Trust X security chip.
Clone the repository with the Git GUI by issuing the following command
git clone --recursive https://github.com/Infineon/getstarted-optiga-trust-x.git
Download the latest version from here.
You can download the latest version of DAVE™ IDE from the official website. You need to get used to the concept of Eclipse IDE.
Open the follwing dialog window File->Import...->Infineon->DAVE Project Depending on how did you get you have two options:
- If you have cloned the repository then set "Select Root Directory" and browse till the cloned getstarted-optiga-trust-x folder. In this case you should see the xmc_application project appear. Figure below depicts the final result.
- If you have downloaded the .zip archive then set "Select Archive File" and browse to the downloaded archive file. You should see the xmc_application project appear. Figure below depicts the final result.

At the end you need to press Finish
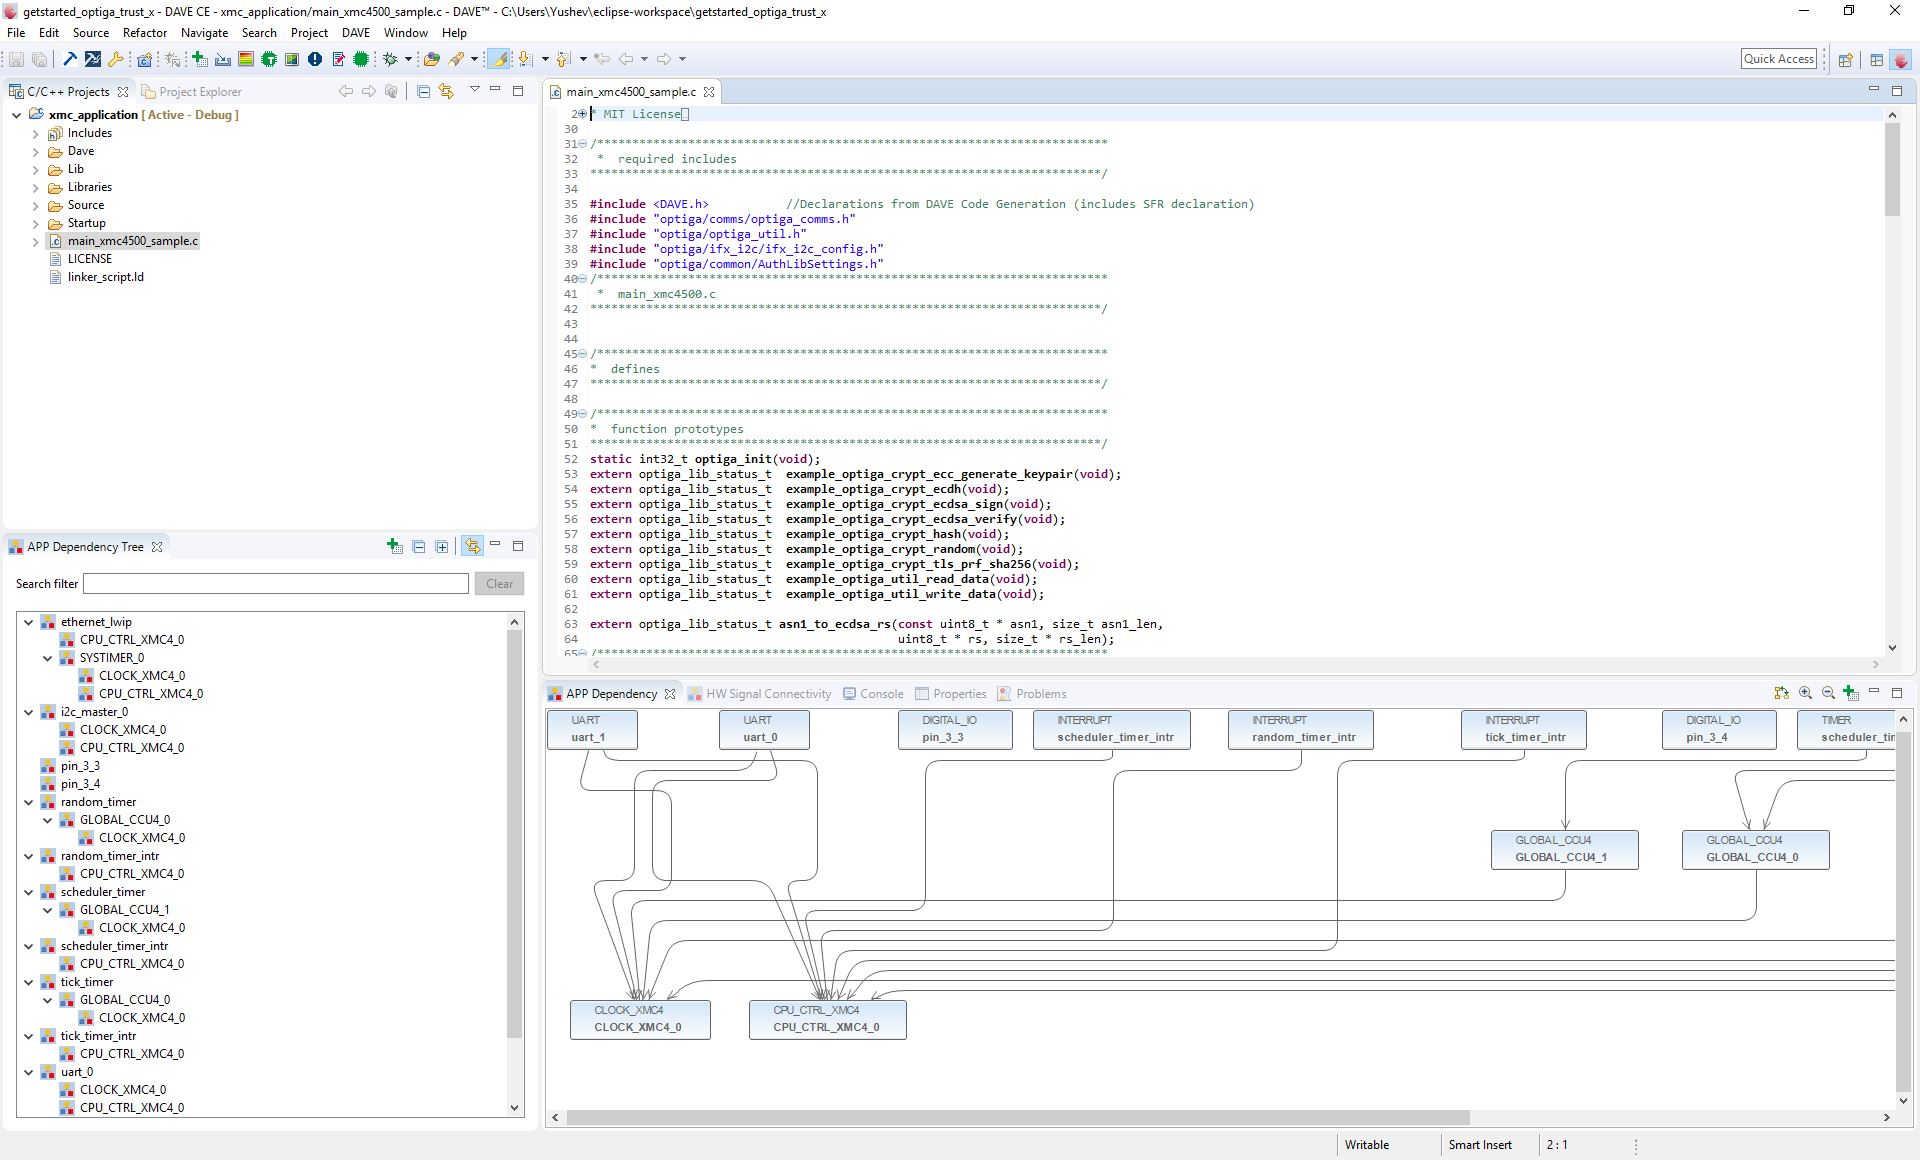
The final project should be similar to what is depicted in the picture below

To build the project you need to press the Project->Build Active Project menu item. Below you can find a successful build output in a console

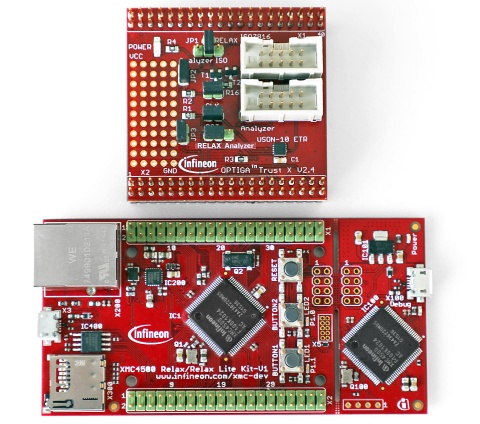
OPTIGA™ Trust X evaluation kit has build-in debugger, which can be accessed via the Micro USB Port on the right side, as depicted below.

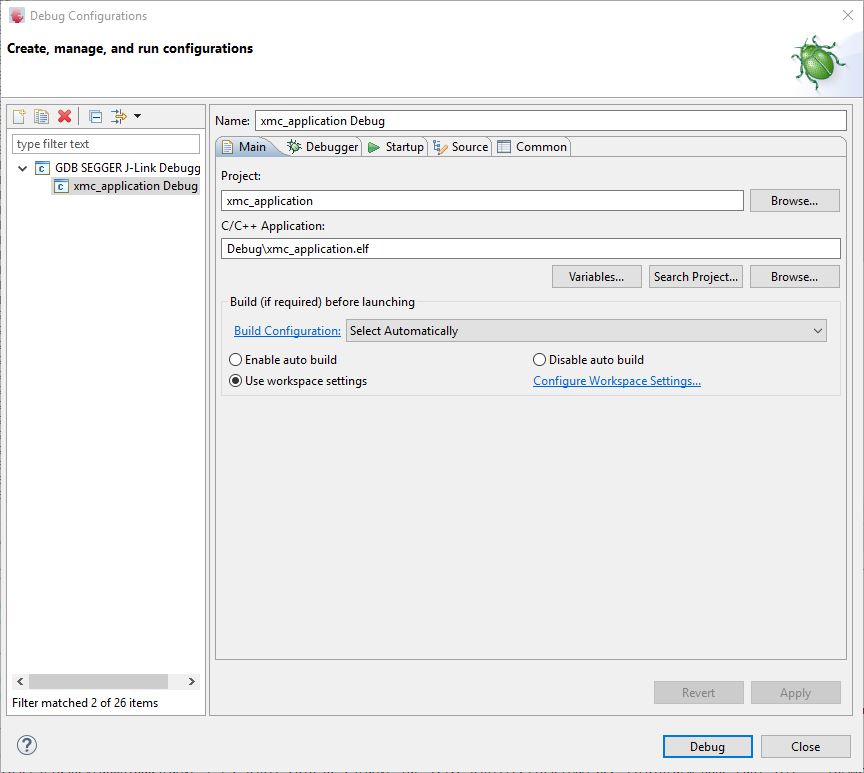
In order to Debug/Flash the board you need to create a new debug configuration via DAVE™. For this you need to click on a green bug symbol on the DAVE™ instrument panel and press it. Afterwords you need to create a new "GDB SEGGER J-Link Debugging" by double clicking on it. The result should look similar to the figure below

You don't need to change any parameter in the configuration, just click the Debug button (the board should be connected to your PC)
You might be requested to update the firmware of the SEGGER J-Link Debugger. It is recommended to update it when requested.
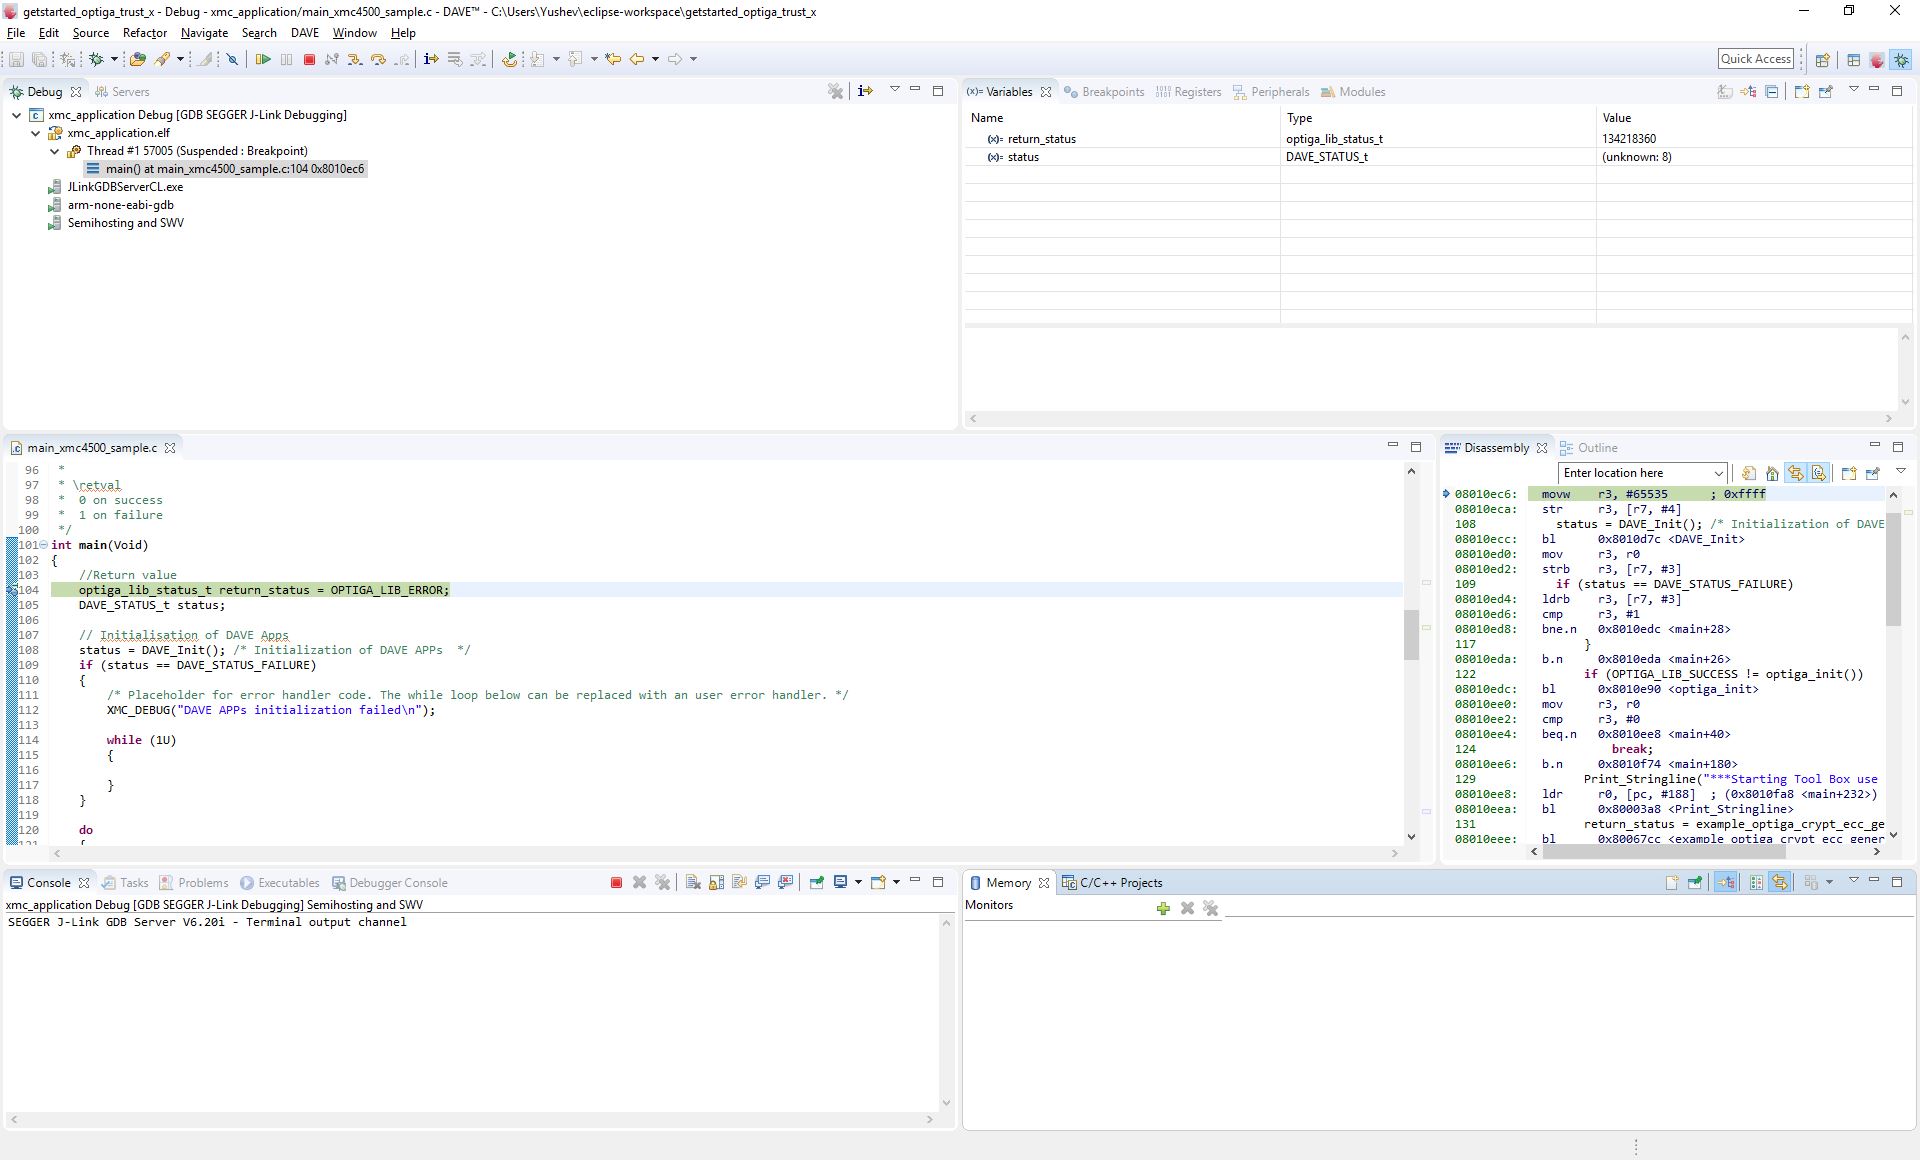
The result debug session should be similar to the figure below

In see debug output via uart to have to attach this adapter to the evalkit.
Adapter -> XMC4500
Rx -> P5.0
Tx -> P5.1
GND -> GND
Use a terminal programm like putty on windows with baudrate 9600 to connect to the kit.
All measurements in this Wiki entry were performed with the setup explained above