af-analysis is a python package for the analysis of AlphaFold protein structure predictions.
This package is designed to simplify and streamline the process of working with protein structures
generated by:
Source code repository: https://github.com/samuelmurail/af_analysis
AlphaFold 2 and its derivatives have revolutionized protein structure prediction, achieving remarkable accuracy.
Analyzing the abundance of resulting structural models can be challenging and time-consuming.
Existing tools often require separate scripts for calculating various quality metrics (pDockQ, pDockQ2, LIS score) and assessing model diversity.
af-analysis addresses these challenges by providing a unified and user-friendly framework for in-depth analysis of AlphaFold 2 results.
- Import AlphaFold or ColabFold prediction directories as pandas DataFrames for efficient data handling.
- Calculate and add additional structural quality metrics to the DataFrame, including:
- pDockQ
- pDockQ2
- LIS score
- Visualize predicted protein models.
- Cluster generated models to identify diverse conformations.
- Select the best models based on defined criteria.
- Add your custom metrics to the DataFrame for further analysis.
af-analysisis available on PyPI and can be installed usingpip:
pip install af_analysis- You can install last version from the github repo:
pip install git+https://github.com/samuelmurail/af_analysis.git@main- AF-Analysis can also be installed easily through github:
git clone https://github.com/samuelmurail/af_analysis
cd af_analysis
pip install .The full documentation is available at ReadTheDocs.
Create the Data object, giving the path of the directory containing the results of the alphafold2/colabfold run.
import af_analysis
my_data = af_analysis.Data('MY_AF_RESULTS_DIR')
Extracted data are available in the df attribute of the Data object.
my_data.dffrom af_analysis import analysis
analysis.pdockq(my_data)
analysis.pdockq2(my_data)- The
dockingpackage contains several function to add metrics like LIS Score:
from af_analysis import docking
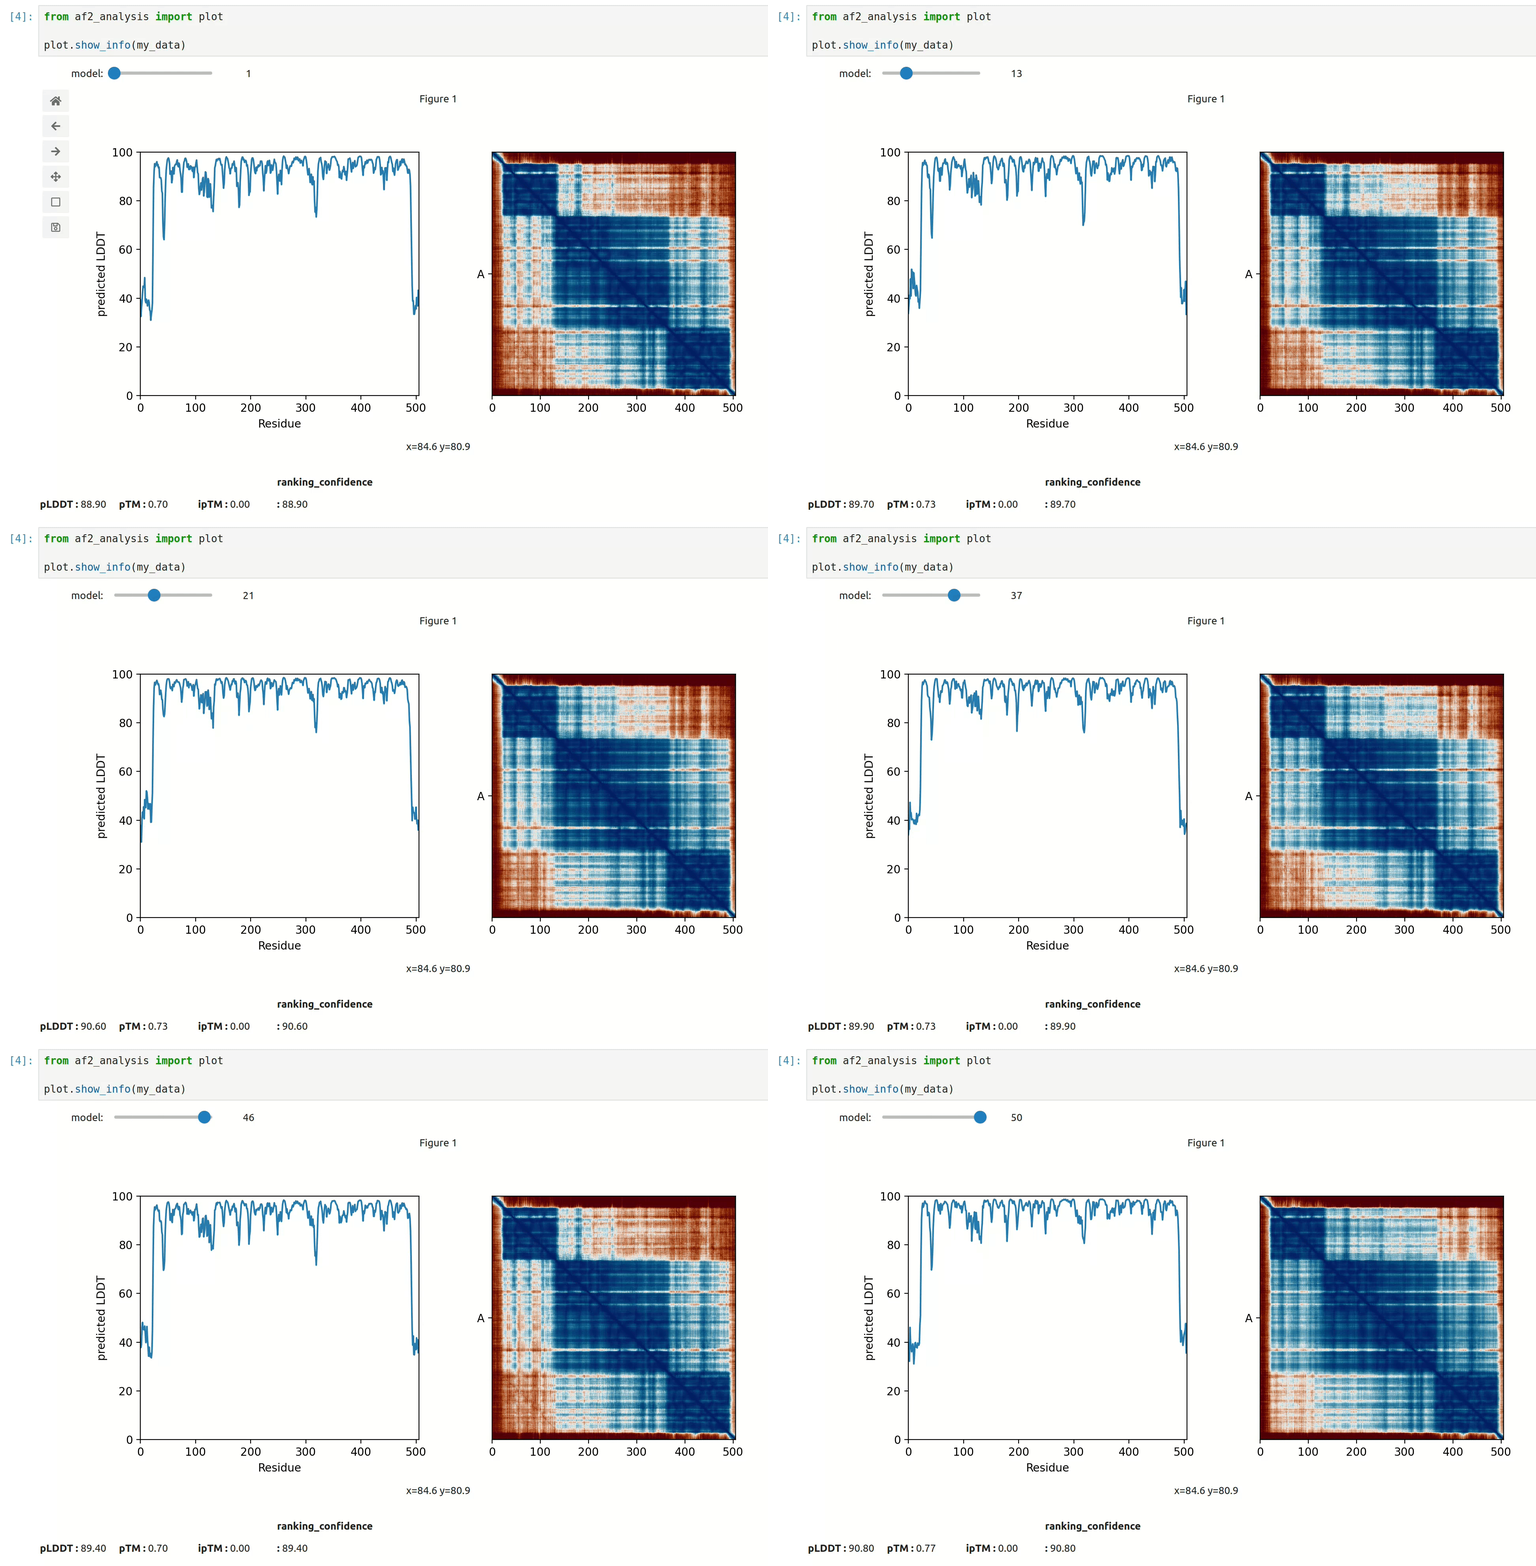
docking.LIS_pep(my_data)- At first approach the user can visualize the pLDDT, PAE matrix and the model scores. The
show_info()function displays the scores of the models, as well as the pLDDT plot and PAE matrix in a interactive way.
- plot msa, plddt and PAE:
my_data.plot_msa()
my_data.plot_plddt([0,1])
best_model_index = my_data.df['ranking_confidence'].idxmax()
my_data.plot_pae(best_model_index)- show 3D structure (
nglviewpackage required):
my_data.show_3d(my_data.df['ranking_confidence'].idxmax())af_analysis requires the following dependencies:
pdb_numpypandasnumpytqdmseaborncmcrameringlviewipywidgetsmdanalysis
af-analysis is an open-source project and contributions are welcome. If
you find a bug or have a feature request, please open an issue on the GitHub
repository at https://github.com/samuelmurail/af_analysis. If you would like
to contribute code, please fork the repository and submit a pull request.
- Alaa Regei, Graduate Student - Université Paris Cité.
- Samuel Murail, Associate Professor - Université Paris Cité, CMPLI.
See also the list of contributors who participated in this project.
This project is licensed under the GNU General Public License version 2 - see the LICENSE file for details.
- Jumper et al. Nature (2021) doi: 10.1038/s41586-021-03819-2
- Abramson et al. Nature (2024) doi: 10.1038/s41586-024-07487-w
- Mirdita et al. Nature Methods (2022) doi: 10.1038/s41592-022-01488-1
- Evans et al. bioRxiv (2021) doi: 10.1101/2021.10.04.463034
- Bryant et al. Nat. Commun. (2022) doi: 10.1038/s41467-022-28865-w
- Zhu et al. Bioinformatics (2023) doi: 10.1093/bioinformatics/btad424
- Kim et al. bioRxiv (2024) doi: 10.1101/2024.02.19.580970
- Yu et al. Bioinformatics (2023) doi: 10.1093/bioinformatics/btac749
- Wohlwend et al. bioRxiv (2024) doi: 10.1101/2024.11.19.624167


