#Silk
Silk is a live profiling and inspection tool for the Django framework. Silk intercepts and stores HTTP requests and database queries before presenting them in a user interface for further inspection:
Silk has been tested with:
- Django: 1.5, 1.6, 1.7, 1.8
- Python: 2.7, 3.3, 3.4
I left out Django <1.5 due to the change in {% url %} syntax. Python 2.6 is missing collections.Counter. Python 3.0 and 3.1 are not available via Travis and also are missing the u'xyz' syntax for unicode. Workarounds can likely be found for all these if there is any demand.
Via pip into a virtualenv:
pip install django-silkIn settings.py add the following:
MIDDLEWARE_CLASSES = (
    ...
    'silk.middleware.SilkyMiddleware',
    ...
)

INSTALLED_APPS = (
    ...
    'silk'
)
Note: The middleware is placement sensitive. If the middleware before silk.middleware.SilkyMiddleware returns from process_request then SilkyMiddleware will never get the chance to execute. Therefore you must ensure that any middleware placed before never returns anything from process_request. See the django docs for more information on this.
Note: If you're using django.middleware.gzip.GZipMiddleware, place that before silk.middleware.SilkyMiddleware, otherwise you'll get an encoding error.
To enable access to the user interface add the following to your urls.py:
urlpatterns += patterns('', url(r'^silk/', include('silk.urls', namespace='silk')))before running syncdb:
python manage.py syncdbSilk will automatically begin interception of requests and you can proceed to add profiling
if required. The UI can be reached at /silk/
Via github tags:
pip install django-silk-<version>.tar.gzYou can install from master using the following, but please be aware that the version in master may not be working for all versions specified in requirements
pip install -e git+https://github.com/mtford90/silk.git#egg=silkSilk primarily consists of:
- Middleware for intercepting Requests/Responses
- A wrapper around SQL execution for profiling of database queries
- A context manager/decorator for profiling blocks of code and functions either manually or dynamically.
- A user interface for inspection and visualisation of the above.
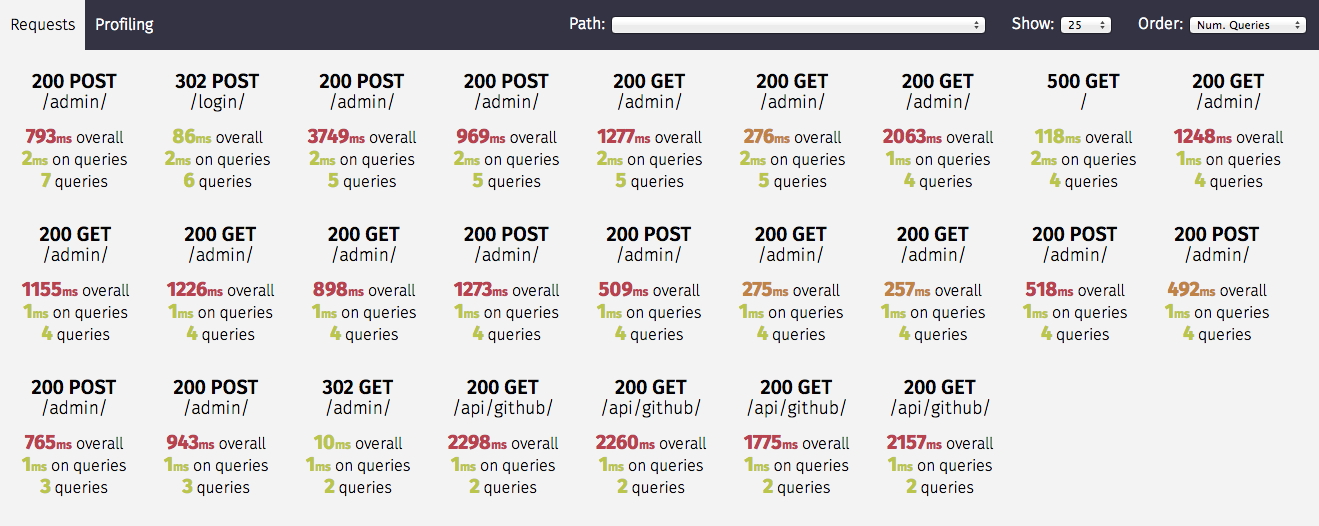
The Silk middleware intercepts and stores requests and responses and stores them in the configured database. These requests can then be filtered and inspecting using Silk's UI through the request overview:
It records things like:
- Time taken
- Num. queries
- Time spent on queries
- Request/Response headers
- Request/Response bodies
and so on.
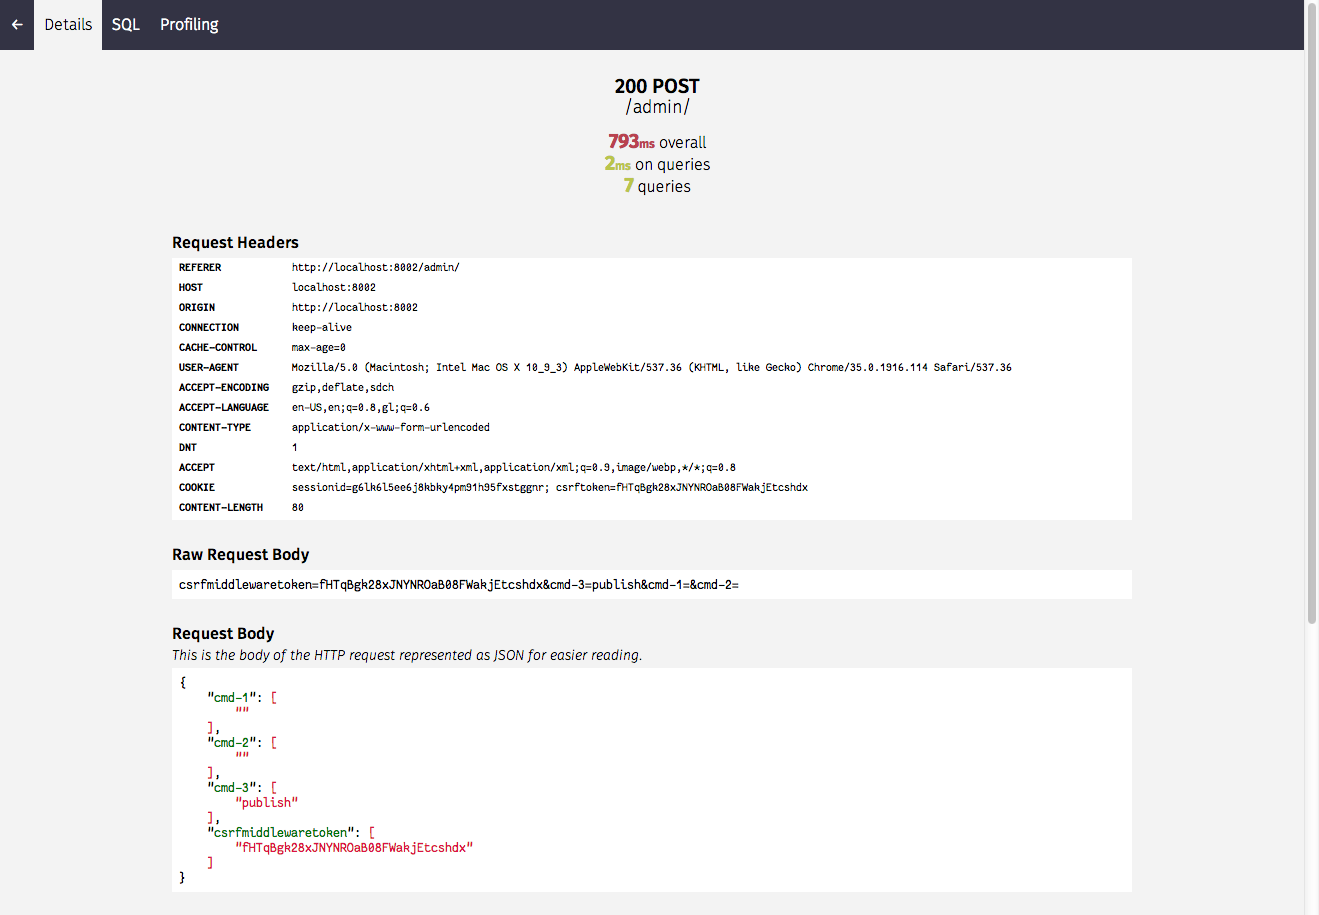
Further details on each request are also available by clicking the relevant request:
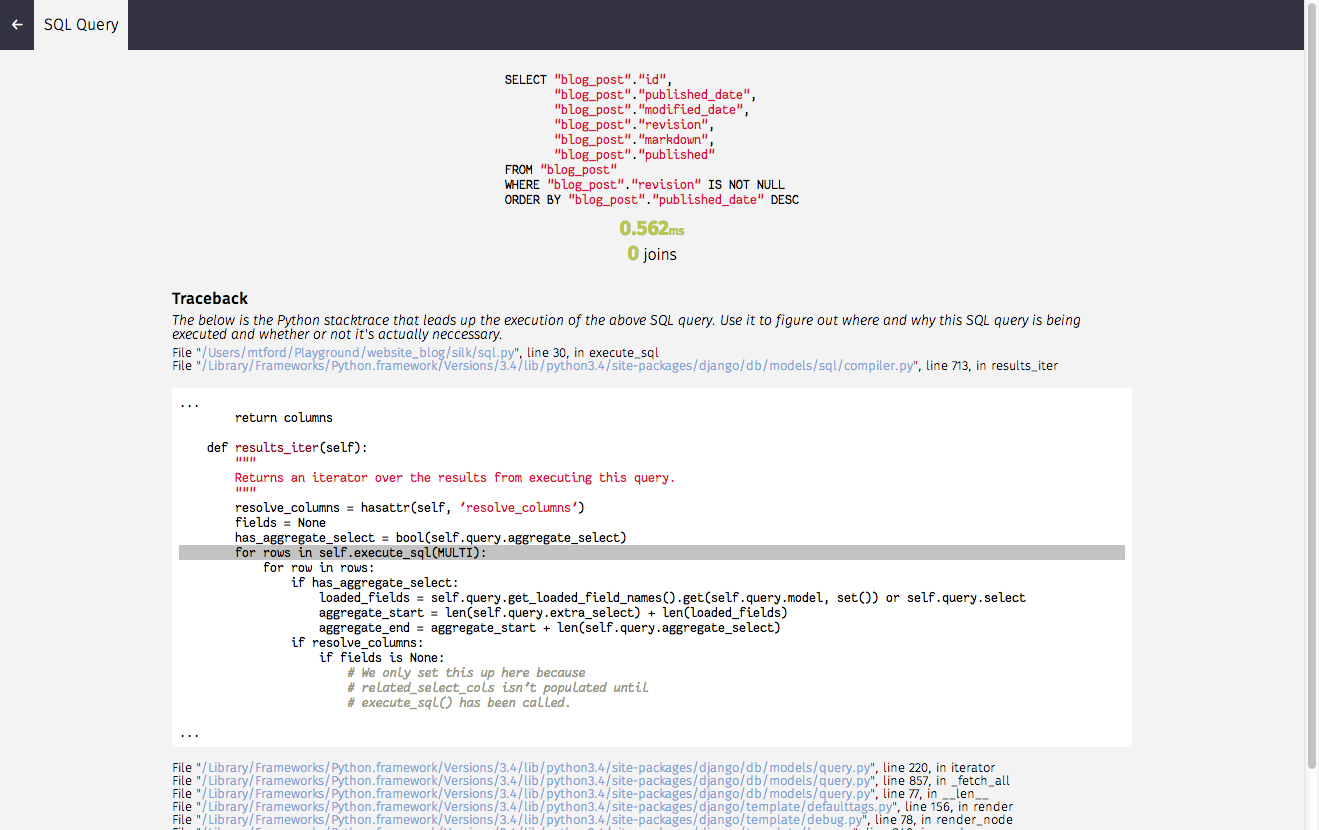
Silk also intercepts SQL queries that are generated by each request. We can get a summary on things like the tables involved, number of joins and execution time:
Before diving into the stack trace to figure out where this request is coming from:
Turn on the SILKY_PYTHON_PROFILER setting to use Python's built-in cProfile profiler. Each request will be separately profiled and the profiler's output will be available on the request's Profiling page in the Silk UI.
SILKY_PYTHON_PROFILER = True
Silk can also be used to profile specific blocks of code/functions. It provides a decorator and a context manager for this purpose.
For example:
@silk_profile(name='View Blog Post')
def post(request, post_id):
    p = Post.objects.get(pk=post_id)
    return render_to_response('post.html', {
        'post': p
    })
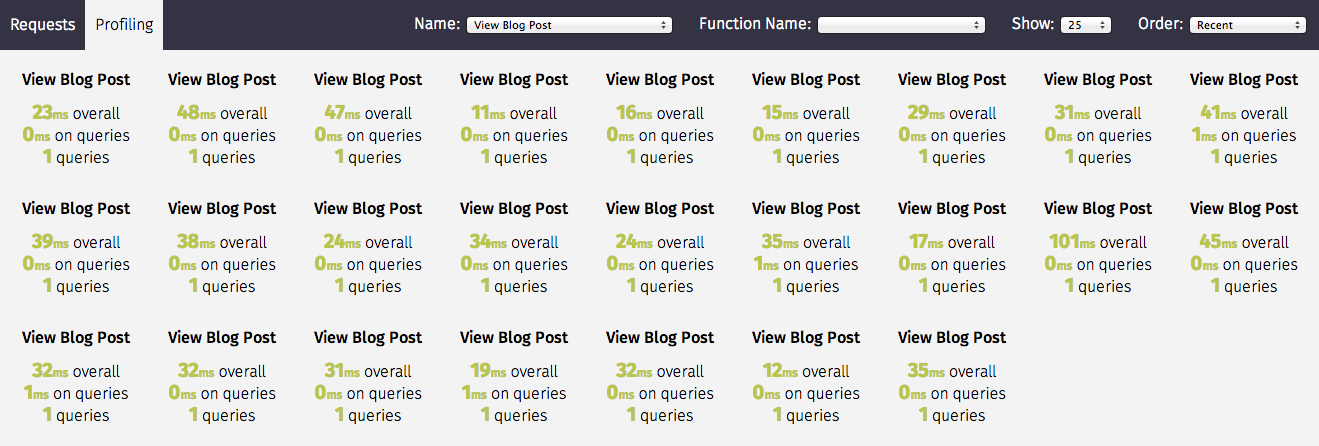
Whenever a blog post is viewed we get an entry within the Silk UI:
Silk profiling not only provides execution time, but also collects SQL queries executed within the block in the same fashion as with requests:
The silk decorator can be applied to both functions and methods
@silk_profile(name='View Blog Post')
def post(request, post_id):
    p = Post.objects.get(pk=post_id)
    return render_to_response('post.html', {
        'post': p
    })

class MyView(View):
	@silk_profile(name='View Blog Post')
	def get(self, request):
		p = Post.objects.get(pk=post_id)
    	return render_to_response('post.html', {
        	'post': p
})Using a context manager means we can add additional context to the name which can be useful for narrowing down slowness to particular database records.
def post(request, post_id):
    with silk_profile(name='View Blog Post #%d' % self.pk):
        p = Post.objects.get(pk=post_id)
    	return render_to_response('post.html', {
        	'post': p
    	})
One of Silk's more interesting features is dynamic profiling. If for example we wanted to profile a function in a dependency to which we only have read-only access (e.g. system python libraries owned by root) we can add the following to settings.py to apply a decorator at runtime:
SILKY_DYNAMIC_PROFILING = [{
    'module': 'path.to.module',
    'function': 'MyClass.bar'
}]
which is roughly equivalent to:
class MyClass(object):
    @silk_profile()
    def bar(self):
        pass
The below summarizes the possibilities:
"""
Dynamic function decorator
"""

SILKY_DYNAMIC_PROFILING = [{
    'module': 'path.to.module',
    'function': 'foo'
}]

# ... is roughly equivalent to
@silk_profile()
def foo():
    pass

"""
Dynamic method decorator
"""

SILKY_DYNAMIC_PROFILING = [{
    'module': 'path.to.module',
    'function': 'MyClass.bar'
}]

# ... is roughly equivalent to
class MyClass(object):

    @silk_profile()
    def bar(self):
        pass

"""
Dynamic code block profiling
"""

SILKY_DYNAMIC_PROFILING = [{
    'module': 'path.to.module',
    'function': 'foo',
    # Line numbers are relative to the function as opposed to the file in which it resides
    'start_line': 1,
    'end_line': 2,
    'name': 'Slow Foo'
}]

# ... is roughly equivalent to
def foo():
    with silk_profile(name='Slow Foo'):
        print (1)
        print (2)
    print(3)
    print(4)
Note that dynamic profiling behaves in a similar fashion to that of the python mock framework in that we modify the function in-place e.g:
""" my.module """
from another.module import foo

# ...do some stuff
foo()
# ...do some other stuff
,we would profile foo by dynamically decorating my.module.foo as opposed to another.module.foo:
SILKY_DYNAMIC_PROFILING = [{
    'module': 'my.module',
    'function': 'foo'
}]
If we were to apply the dynamic profile to the functions source module another.module.foo after
it has already been imported, no profiling would be triggered.
Silk currently generates two bits of code per request:
Both are intended for use in replaying the request. The curl command can be used to replay via command-line and the python code can be used within a Django unit test or simply as a standalone script.
By default anybody can access the Silk user interface by heading to /silk/. To enable your Django
auth backend place the following in settings.py:
SILKY_AUTHENTICATION = True  # User must login
SILKY_AUTHORISATION = True  # User must have permissions
If SILKY_AUTHORISATION is True, by default Silk will only authorise users with is_staff attribute set to True.
You can customise this using the following in settings.py:
def my_custom_perms(user):
    return user.is_allowed_to_use_silk

SILKY_PERMISSIONS = my_custom_permsBy default, Silk will save down the request and response bodies for each request for future viewing no matter how large. If Silk is used in production under heavy volume with large bodies this can have a huge impact on space/time performance. This behaviour can be configured with following options:
SILKY_MAX_REQUEST_BODY_SIZE = -1  # Silk takes anything <0 as no limit
SILKY_MAX_RESPONSE_BODY_SIZE = 1024 # If response body>1024kb, ignoreSometimes its useful to be able to see what effect Silk is having on the request/response time. To do this add
the following to your settings.py:
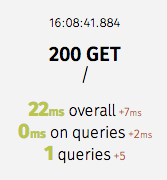
SILKY_META = TrueSilk will then record how long it takes to save everything down to the database at the end of each request:
Note that in the above screenshot, this means that the request took 29ms (22ms from Django and 7ms from Silk)
On high-load sites it may be helpful to only record a fraction of the requests that are made.To do this add the following to your settings.py:
Note: This setting is mutually exclusive with SILKY_INTERCEPT_FUNC.
SILKY_INTERCEPT_PERCENT = 50 # log only 50% of requestsOn high-load sites it may also be helpful to write your own logic for when to intercept requests.To do this add the following to your settings.py:
Note: This setting is mutually exclusive with SILKY_INTERCEPT_PERCENT.
def my_custom_logic(request):
    return 'record_requests' in request.session

SILKY_INTERCEPT_FUNC = my_custom_logic # log only session has recording enabled.A management command will wipe out all logged data:
python manage.py silk_clear_request_log