suri-stats is a small script based on ipython and matplotlib. It enables you to load a suricata stats.log file and/or JSON EVE file. Once this is done, it is possible to graph performance indicators.
You can simply run
./setup.py install
For a complete usage message, run
suri-stats -h
Let's assume we've got a stats.log in /tmp/. Being in the suri-stats directory, one can run
suri-stats
You will be given a shell.
First thing to do is to create on Stats object
In [1]: ST=Stats("long run")
In [2]: ST.load_file("/tmp/stats.log")
To load a JSON file
In [1]: ST=Stats("modern run")
In [2]: ST.load_json_file("/tmp/stats.json")
This can take some time if the file is big.
You can also directly work on a file by running
suri-stats /tmp/stats.log
or for a JSON file
suri-stats -e /tmp/stats.log
The ST object will be created automatically.
Now, it is possible to list the retrieve counters
In [3]: ST.list_counters()
Out[3]:
['decoder.udp',
 'decoder.avg_pkt_size',
 'tcp.memuse',
 'tcp.segment_memcap_drop',
 'defrag.ipv6.fragments',
 'decoder.sctp',
 'tcp.reassembly_gap',
 ...
 'decoder.pppoe',
 'capture.kernel_drops',
 'tcp.synack',
 'flow_mgr.closed_pruned',
 'decoder.ipv6',
 'decoder.pkts',
 'decoder.ipv4',
 'tcp.reassembly_memuse',
 'capture.kernel_packets']
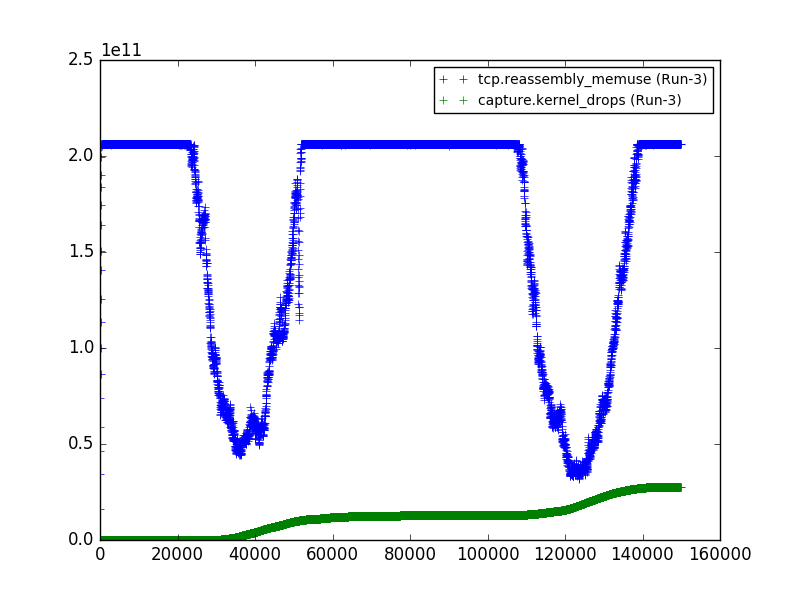
And you can now graph the value you want, successive call to plot will result in adding the graph on the output
In [4]: ST.plot('tcp.reassembly_memuse')
In [5]: ST.plot('capture.kernel_drops')
You can even save the file in a file
In [6]: savefig("correl.png")
In fact, you can use any function of matplotlib.
If your statistics file contains the log for multiple suricata runs, you will be able to access to the different runs by using the .runs array of the Stats object. Each element of the array is one Stats object with the first element being the initial Stats object itself.
For example, to display the kernel drop for the two first runs
In <10>: print ST.runs[1].plot('capture.kernel_drops')
In <11>: print ST.runs[0].plot('capture.kernel_drops')
It is possible to output stats on a file
suri-stats -s -c decoder.pkts,decoder.ipv4,decoder.ipv6 -S  stats.log -v
Created ST object for run 'Run'
Loading stats.log file 'stats-short.log'
Key:Min:Mean:Max:Std
decoder.ipv4:1261291.582492:1313827.987111:1427241.263158:23698.509236
decoder.ipv6:2357.928211:2685.328384:4111.746809:210.005908
decoder.pkts:1257964.710665:1311786.272049:1423458.157895:24212.591057
It is also possible to directly plot the result
suri-stats -p -c decoder.pkts,decoder.ipv4,decoder.ipv6 -S -o /tmp/out.png stats.log
You can also output the result other formats by changing the output extension. For example to have a PDF output
suri-stats -p -c decoder.pkts,decoder.ipv4,decoder.ipv6 -S -o /tmp/out.pdf stats.log
If your file contains multiple run, you can use -r flag to select it (count starting at 0).
The stats are merged by default. But it is possible display on graph per-thread
In [7]: ST.plot("detect.alert", merge=False)
It is also possible to plot for one single thread
In [8]: ST.plot('tcp.sessions', 'AFPacketeth310')
To get the list of threads you can use
In [9]: ST.list_threads('tcp.sessions')
To start a new graph, you can use the clf() function or close the graph window.
To graph speed instead of raw data, you can use
In [10]: ST.plot('tcp.sessions', speed=True)
To graph normalized data instead of raw data, you can use
In [11]: ST.plot('capture.kernel_drops', normalized=True)
In [12]: ST.plot('decoder.tcp', normalized=True)
This will allow you to graph data with different scales on the same graph as both data are normalized.
suri-stats provide a script named 'suri-graphite' which can be used to sent suricata performance counters to a Graphite server. suri-graphite connect to Suricata unix socket and dump counters at a regular interval (suricata 1.4.1 or git necessary) and it sends this data to the Graphite server specified by -H flag.
