Copyright and other protections apply.
Please see the accompanying LICENSE file for rights and restrictions governing use of this software.
All rights not expressly waived or licensed are reserved.
If that file is missing or appears to be modified from its original, then please contact the author before viewing or using this software in any capacity.
anydyce – visualization tools for dyce
anydyce exposes an interactive interface to dyce (the dice mechanic modeling library) in Jupyter similar to AnyDice.
anydyce is licensed under the MIT License.
See the accompanying LICENSE file for details.
Non-experimental features should be considered stable.
See the release notes for a summary of version-to-version changes.
Source code is available on GitHub.
If you find it lacking in any way, please don’t hesitate to bring it to my attention.
anydyce (currently) targets Matplotlib (both alone and within Jupyter).
Support for additional visualization tools may be added in the future.
It is intended as a convenience layer for those who benefit from simple interfaces with reasonable defaults and limited configurability.
If you find they are too restrictive, or have any requests or ideas for improvements, let me know!1
If used within Jupyter, anydyce provides a high-level, interactive interface with functionality that echos AnyDice.
| Feature | anydyce |
AnyDice |
|---|---|---|
| Shareable session URLs | ✅ Yes | |
| Modeling language | 🐍 Python | Proprietary |
| Computation time limit | ✅ No limit | ❌ 5 seconds |
| Configurable plots (including “burst” graphs) |
✅ Yes | ❌ No |
| Install and use third party libraries | ✅ Yes | ❌ No |
| Open source (install, run, and modify locally) |
✅ Yes | ❌ No |
| Advanced language features (memoization, nested functions, etc.) |
✅ Yes | ❌ No |
Probably the easiest way to start tinkering with anydyce is with JupyterLite:
The quickstart-local.sh script will create a local virtual environment to bootstrap a local Jupyter server with anydyce installed and open a web browser to the introduction notebook.
Binder is another great resource that you can use to share notebooks from your Git repositories (including Gists):
!!! danger "JupyterLite and Binder may not save your work!"
JupyterLite attempts to make use of your browser’s local storage for saving notebook changes.
Browser environments vary, including how long local storage is persisted.
Further, Binder loses all state once its instances shut down after a period of inactivity.
Be careful to download any notebooks you wish to keep.
When creating your own notebooks, including and running the following will bootstrap anydyce if it is not already installed:
# Install additional requirements if necessary
import warnings
with warnings.catch_warnings():
    warnings.simplefilter("ignore")
    try:
        import anydyce
    except (ImportError, ModuleNotFoundError):
        requirements = ["anydyce~=0.2"]
        try:
            import piplite ; await piplite.install(requirements)
        except ImportError:
            import pip ; pip.main(["install"] + requirements)
import anydyceanydyce is available as a PyPI package and as source.
anydyce.viz provides some rudimentary conveniences such as “burst” charts (anydyce’s take on donut charts).
>>> import matplotlib.pyplot
>>> from dyce import H
>>> from anydyce.viz import plot_burst
>>> ax = matplotlib.pyplot.axes()
>>> plot_burst(ax, 2@H(6))
>>> matplotlib.pyplot.show()  # doctest: +SKIP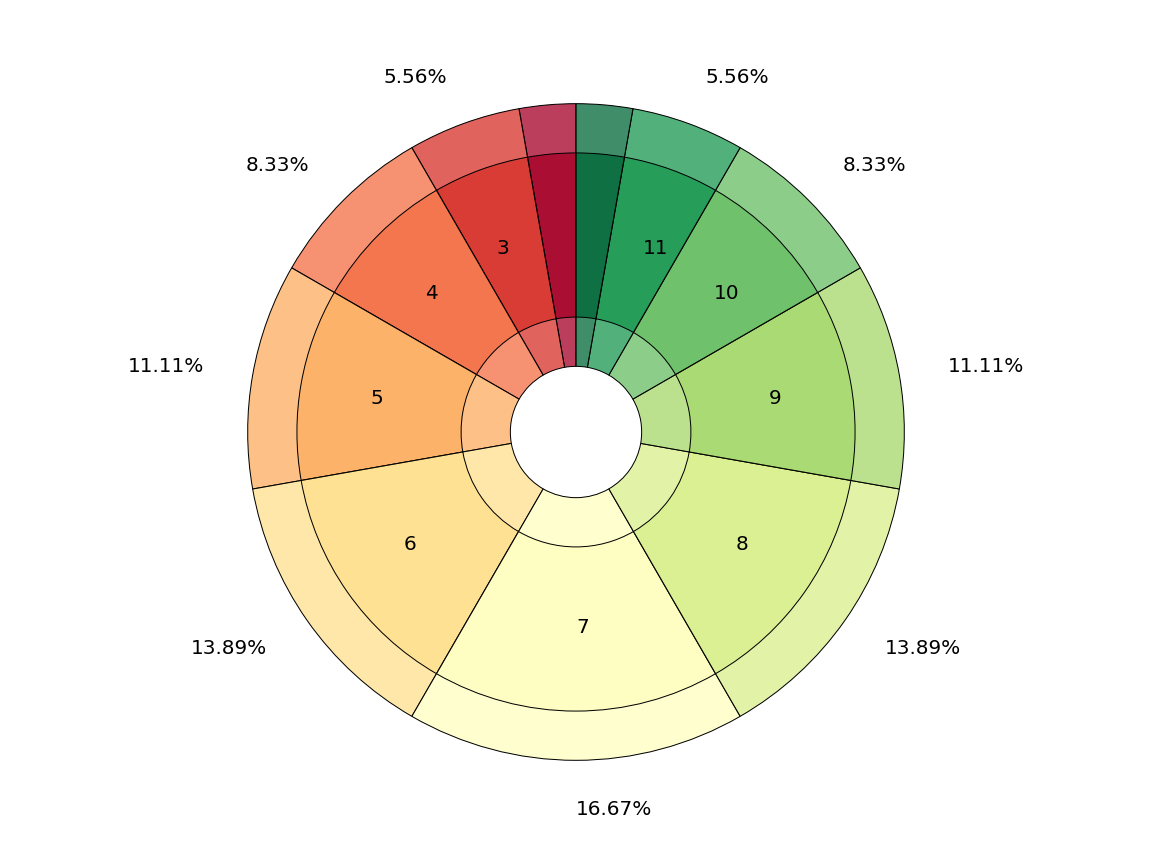
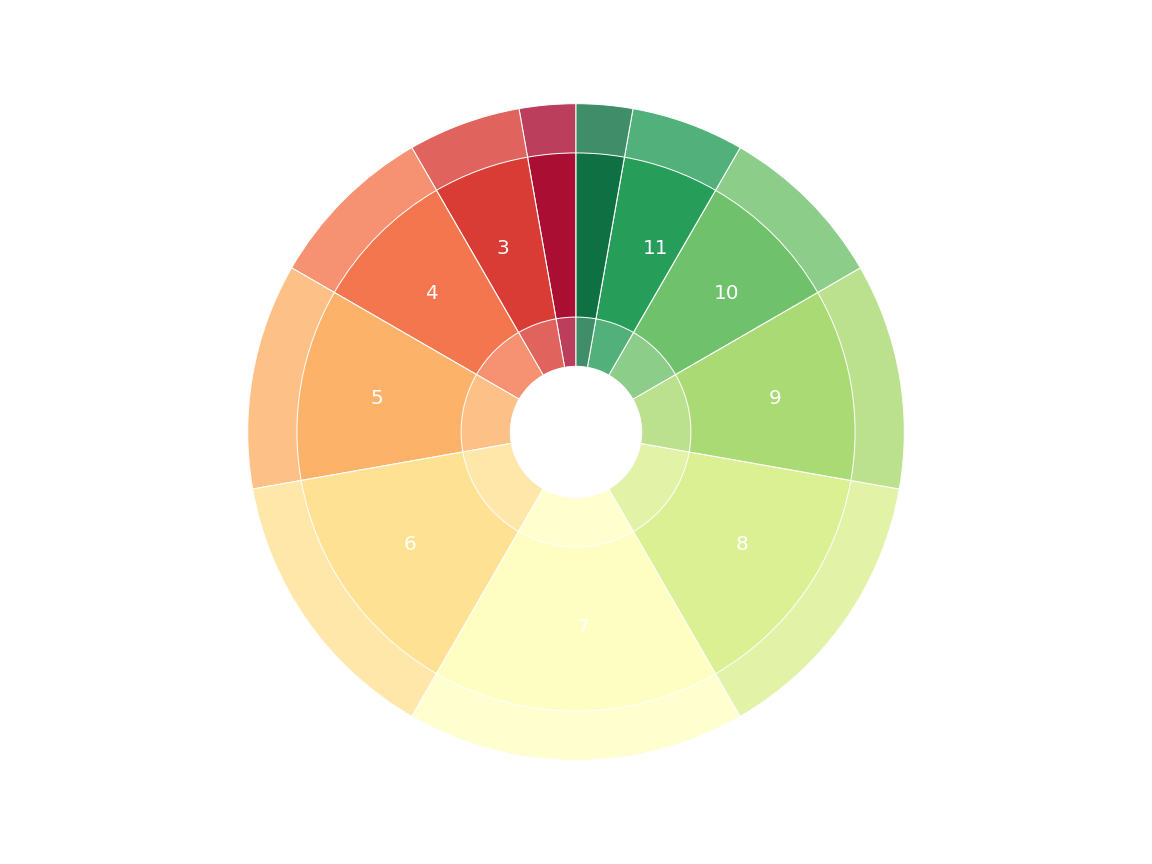
Source: plot_burst_1.py
--8<-- "docs/assets/plot_burst_1.py"The outer ring can also be used to compare two histograms directly.
Ever been curious how your four shiny new fudge dice stack up against your trusty ol’ double six-siders?
Well wonder no more!
anydyce abides.
>>> df_4 = 4@H((-1, 0, 1))
>>> d6_2 = 2@H(6)
>>> ax = matplotlib.pyplot.axes()
>>> plot_burst(
...   ax,
...   df_4, d6_2,
...   inner_cmap="turbo",
...   alpha=1.0,
... )
>>> matplotlib.pyplot.show()  # doctest: +SKIP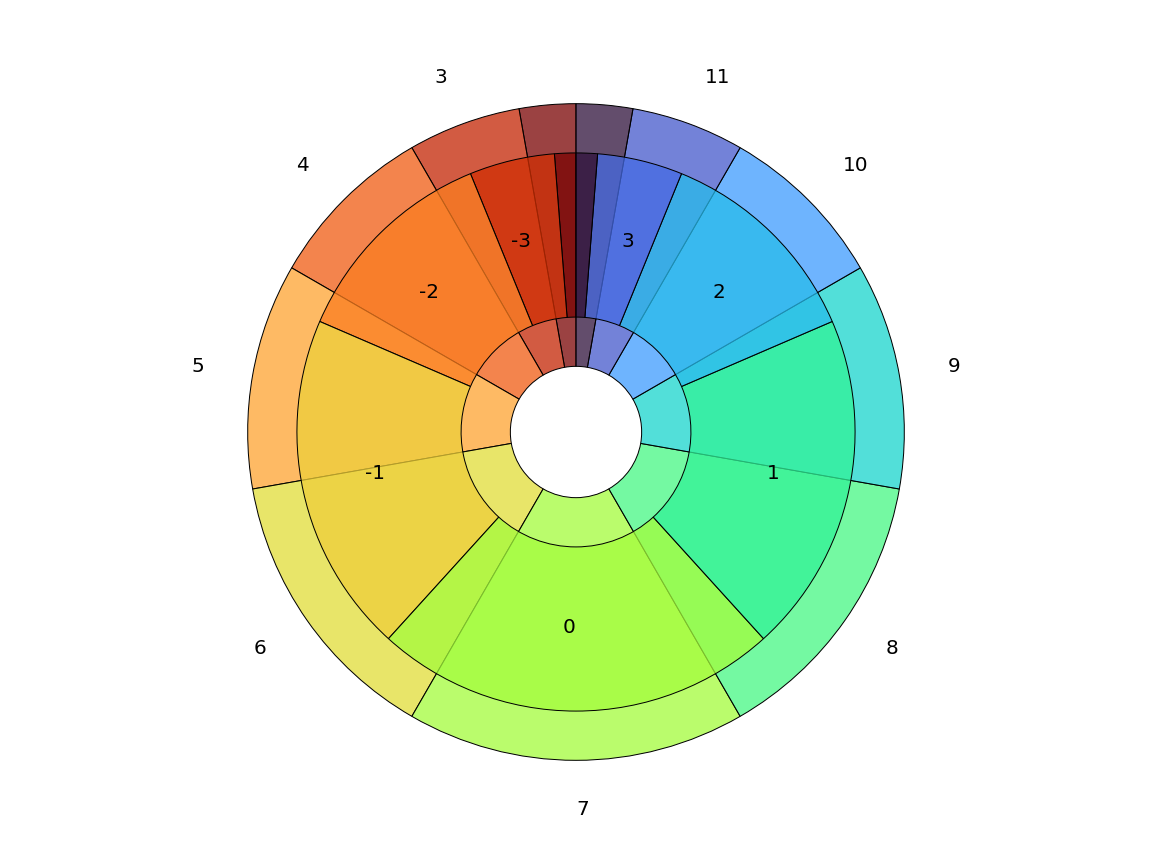
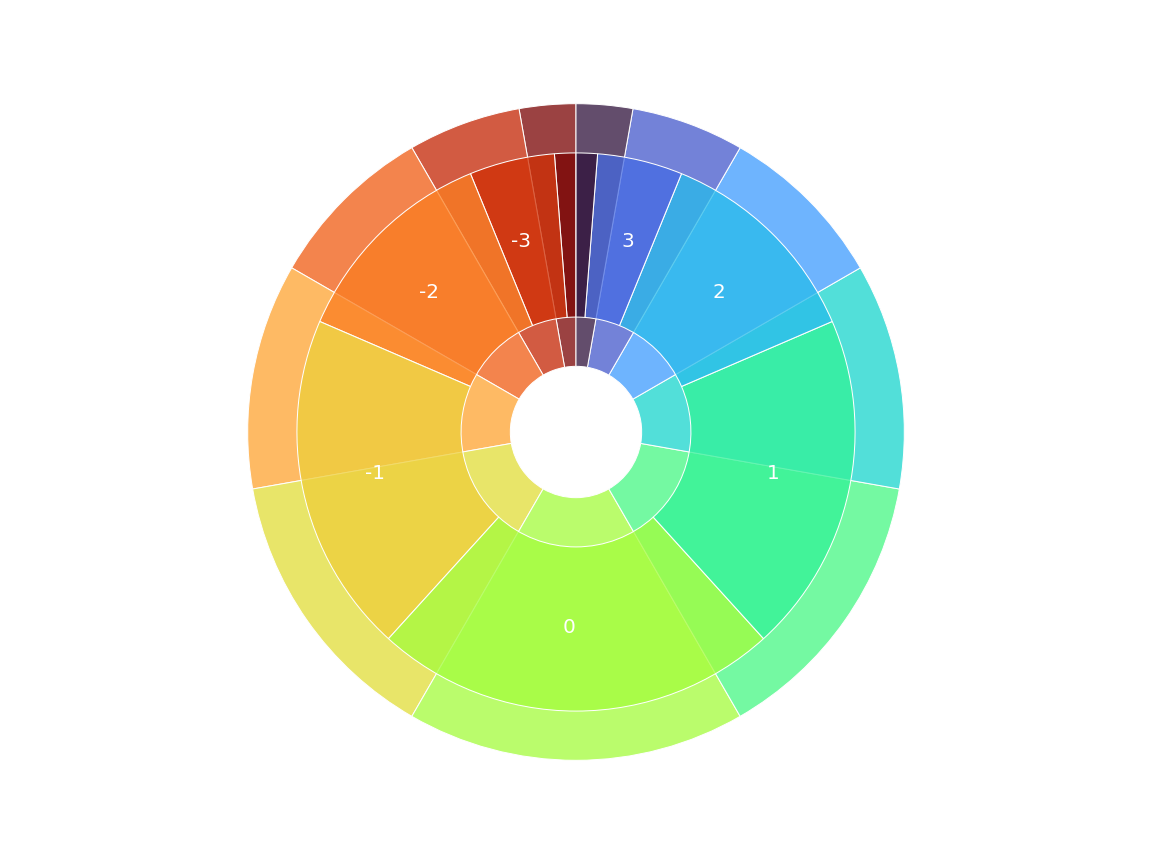
Source: plot_burst_2.py
--8<-- "docs/assets/plot_burst_2.py"Labels can even be overridden for interesting, at-a-glance displays. Overrides apply counter-clockwise, starting from the 12 o’clock position.
>>> def d20formatter(outcome, probability, h) -> str:
...   vals = {
...     -2: "crit. fail.",
...     -1: "fail.",
...     1: "succ.",
...     2: "crit. succ.",
...   }
...   return vals[outcome]

>>> d20 = H(20)
>>> ax = matplotlib.pyplot.axes()
>>> plot_burst(ax, h_inner=d20, h_outer=H({
...   -2: d20.le(1)[1],
...   -1: d20.within(2, 14)[0],
...   1: d20.within(15, 19)[0],
...   2: d20.ge(20)[1],
... }), inner_cmap="RdYlBu_r", outer_formatter=d20formatter)
>>> matplotlib.pyplot.show()  # doctest: +SKIP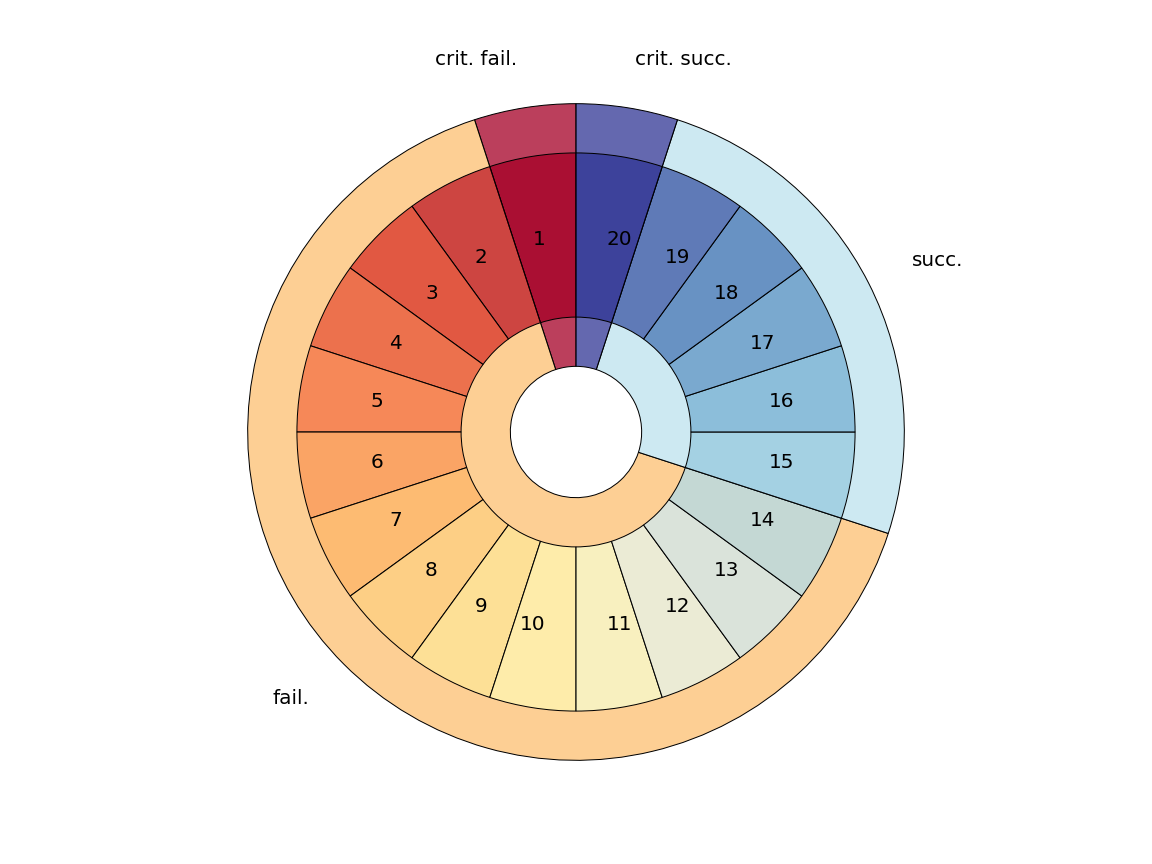
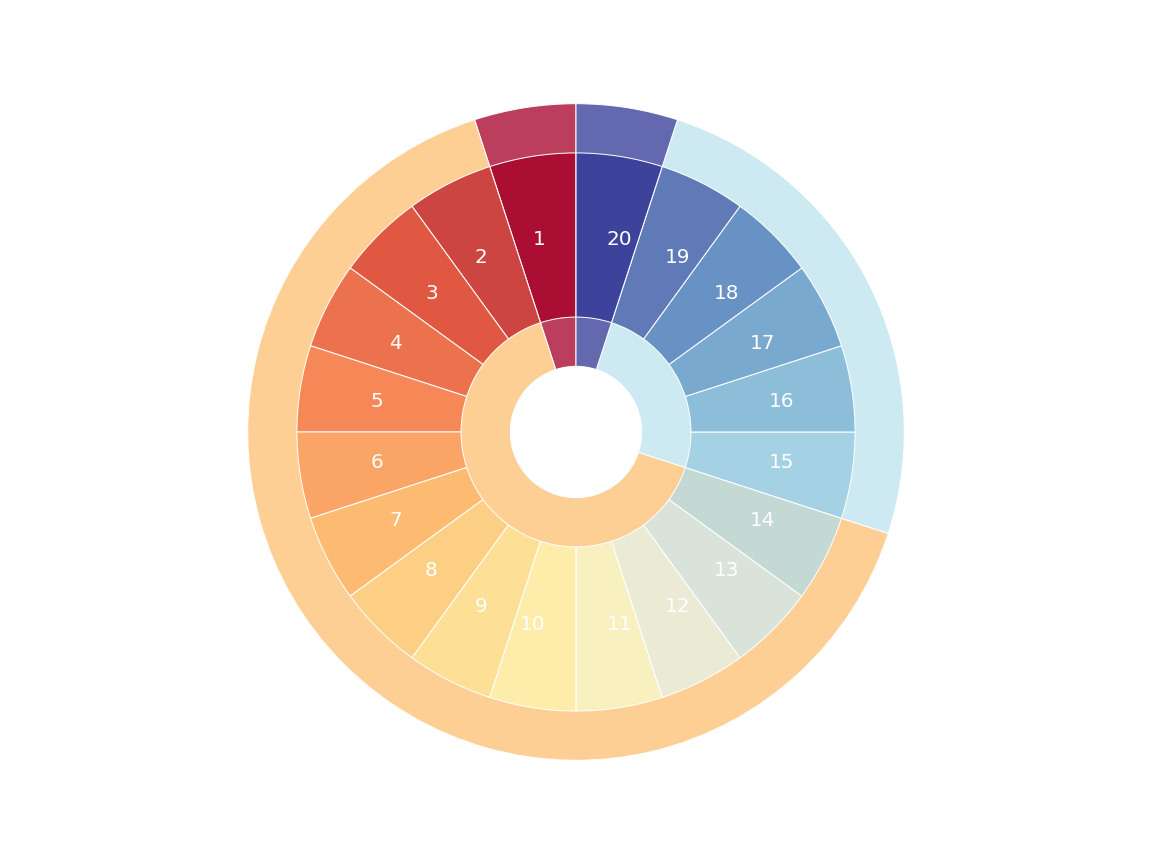
Source: plot_burst_3.py
--8<-- "docs/assets/plot_burst_3.py"anydyce requires a relatively modern version of Python:
- CPython (3.9+)
PyPy (CPython 3.9+ compatible)See beartype/beartype#324
It has the following runtime dependencies:
dycefor dice mechanic modelingipywidgetsfor interactivity in Jupytermatplotlibfor visualizing histograms and pools
anydyce (and dyce) leverage numerary for its opportunistic use of beartype. If you use beartype for type checking your code, but don’t want anydyce, dyce, or numerary to use it internally, disable it with numerary’s NUMERARY_BEARTYPE environment variable.
See the hacking quick-start for additional development and testing dependencies.
anydyce is licensed under the MIT License.
See the included LICENSE file for details.
Source code is available on GitHub.
- This could be you! 👋
Do you have a project that uses dyce?
Let me know, and I’ll promote it here!
And don’t forget to do your part in perpetuating gratuitous badge-ification!
<!-- Markdown -->
As of version 1.1, HighRollin is
[][dyce-powered]!
[dyce-powered]: https://posita.github.io/dyce/ "dyce-powered!"..
reStructuredText - see https://docutils.sourceforge.io/docs/ref/rst/directives.html#image
As of version 1.1, HighRollin is |dyce-powered|!
.. |dyce-powered| image:: https://raw.githubusercontent.com/posita/dyce/latest/docs/dyce-powered.svg
:align: top
:target: https://posita.github.io/dyce/
:alt: dyce-powered<!-- HTML -->
As of version 1.1, HighRollin is <a href="https://posita.github.io/dyce/"><img
src="https://raw.githubusercontent.com/posita/dyce/latest/docs/dyce-powered.svg"
alt="dyce-powered"
style="vertical-align: middle;"></a>!Footnotes
-
At some point this devolves into an exercise in chasing a diversity of very specific preferences. If you have a very specific need,
dyceis fairly low level and should be able to integrate directly with whatever visualization context or package you prefer. That being said, I am always on the lookout for more intuitive or accessible visualizations and will eagerly explore ideas with you. ↩ -
Relies on external depedencies such as Binder or JupyterLite. (See Interactive quick start.) However, edits are not persisted. Notebooks can also be downloaded and shared as
.ipynbfiles. ↩


