-
Notifications
You must be signed in to change notification settings - Fork 47
Quick Start
Installation packages for your system can be found in the Releases Section for XyGrib on Github
For installation help please see the Installer Framework page.
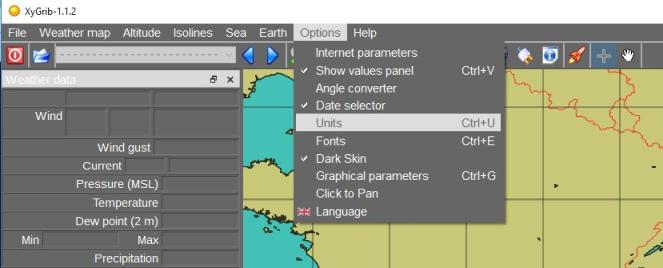
Open the "Options->Units menu selection.
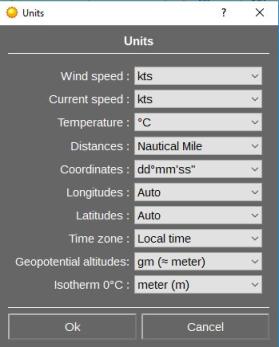
This brings up the Units Dialog. in the Units Dialog set the settings appropriate for you. Choose local time (which is taken from the computer system) or UTC or an appropriate time zone.
Use the “File->Open” menu option or use the "File Open icon", second on the left of the toolbar Once the grib file is opened the program may zoom to the file coverage (set or unset this action in “Earth” menu). You can go to the Grib area by clicking on the 3rd magnifying glass or by pressing Ctrl-z.
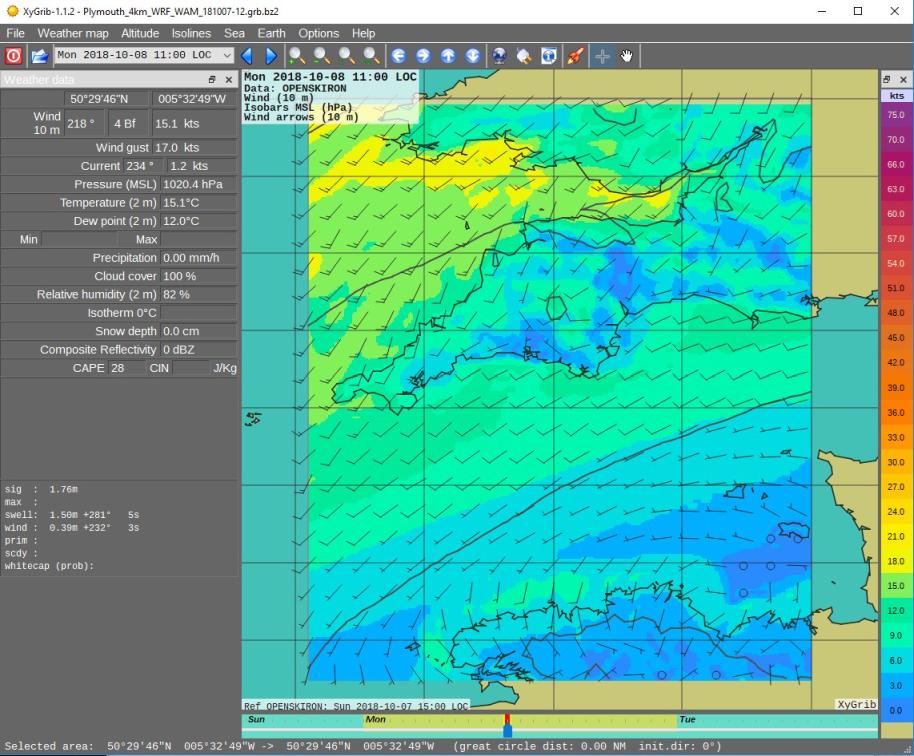
XyGrib with an OpenSkiron.org Grib file of 4km resolution for Plymouth
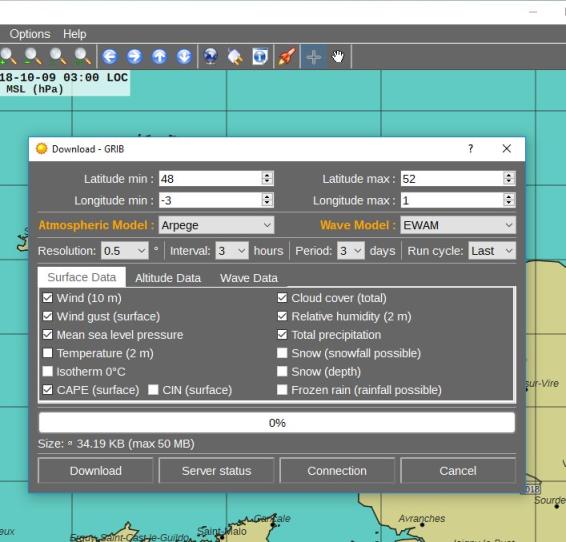
If you wish to view the forecast from global models you can use the internal download facility in XyGrib. First set select your requested area on the map by dragging the cursor. Then to get the download dialog click the globe in the toolbar or go to the “File->Download GRIB” menu.
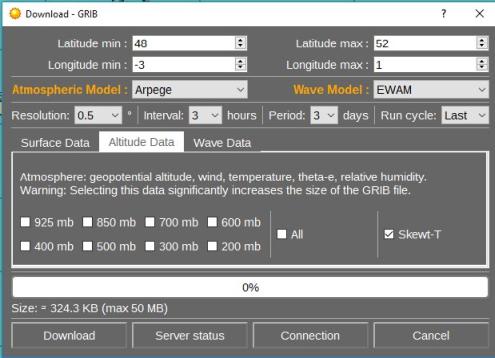
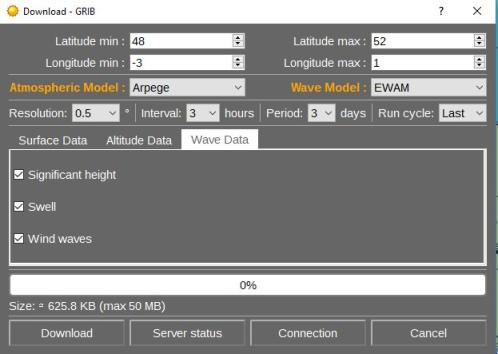
The choice of models and parameters is set on the dialog. Note that there is a tab for surface atmospheric data, a tab for altitude data and a tab for wave data.
The grib will download, request to be saved and will finally open.
The altitude tab is shown above and the wave tab is shown below. Please note that the grib server may take several minutes to prepare requests with altitude data.
To scroll through or set the forecast time you can use the Date/Time selector or use the two blue arrows directly to the right of the selector.
Alternately, you can drag the time indicator at the bottom of the window.
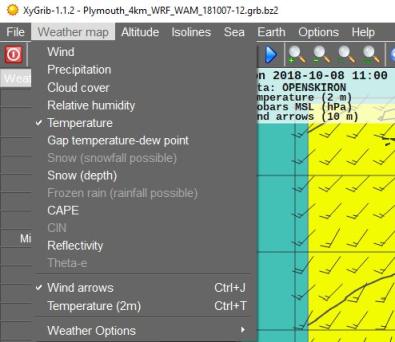
The overlay colors, arrows, numbers that are displayed can be controlled in the “Weather Map” menu.
More options exist in the “Weather Map -> Options menu”
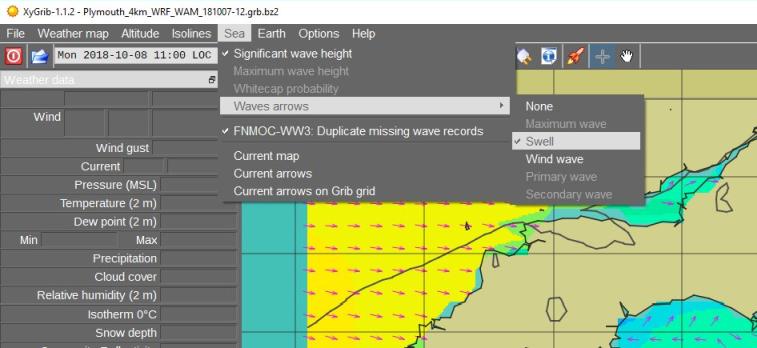
Sea overlay colors and wave arrows are found in the “Sea” menu and sub-menus.
Display of currents is also found in this section.
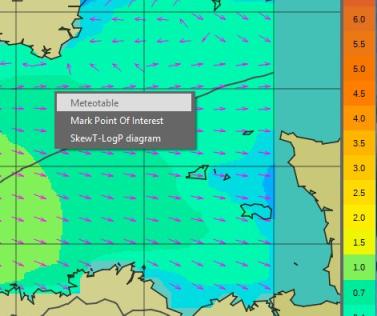
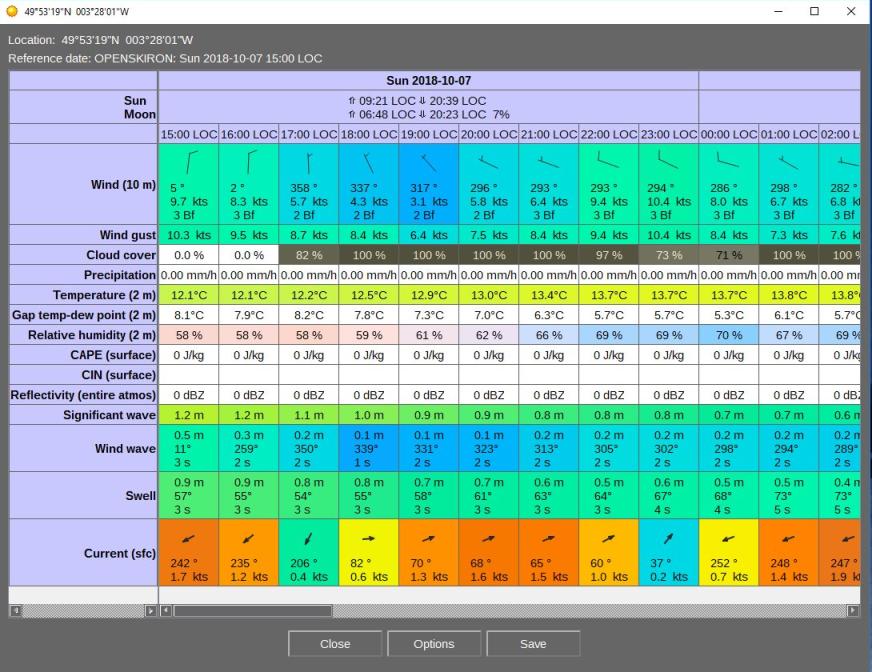
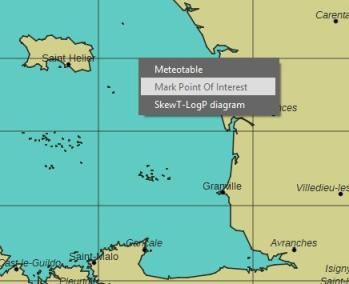
Simply right-click at any point in the map and the Meteotable will open
In the resulting meteotable use the options button to organize what you wish to display including waves and currents. You might wish to set 100% clouds as 'dark'.
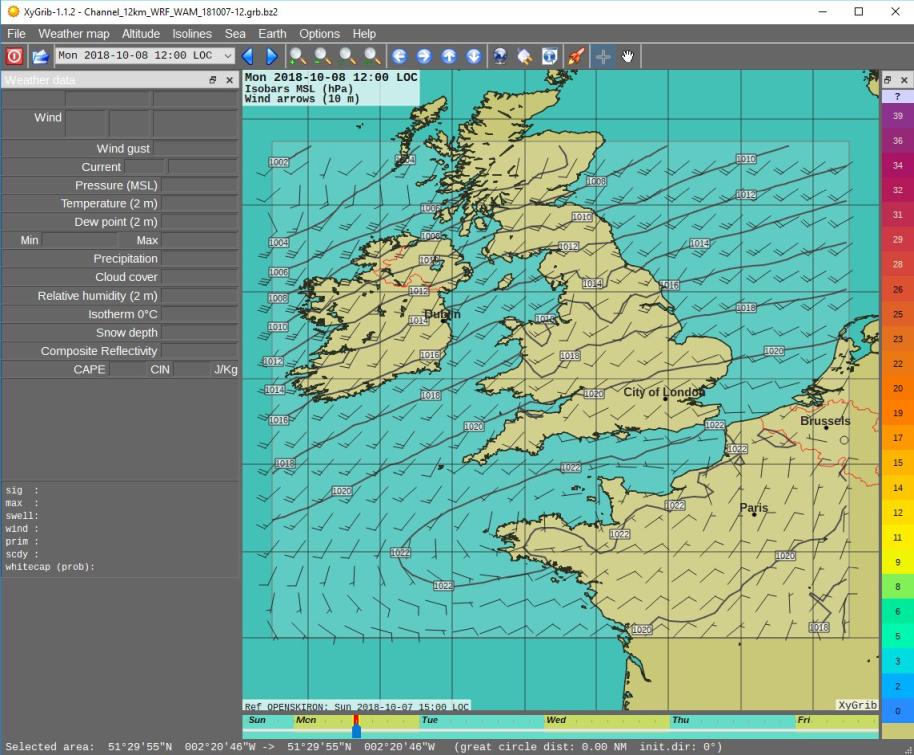
The "Isolines" menu can be used to set which isolines are displayed and it is possible to change settings for isolines.
The following image shows isobars set to 2 mb spacing with labels.
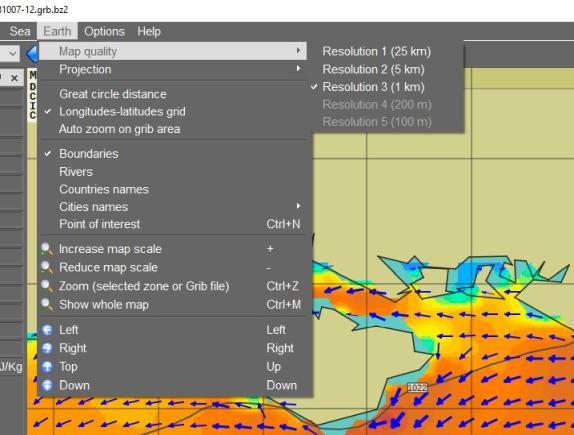
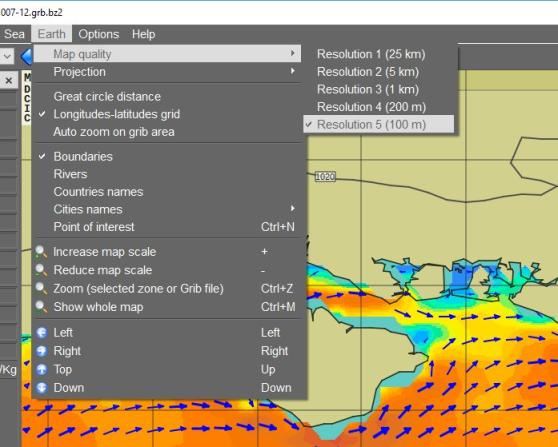
Map resolution can be selected from the "Earth->Map Quality" menu selection.
If the optional high resolution maps have not been installed resolutions 4 and 5 will not be available.
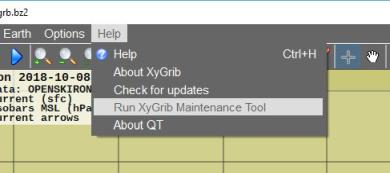
To add high resolution maps use the XyGrib Maintenance Tool which can be started from the help menu or alternately from your system Start/Launch or whatever system/
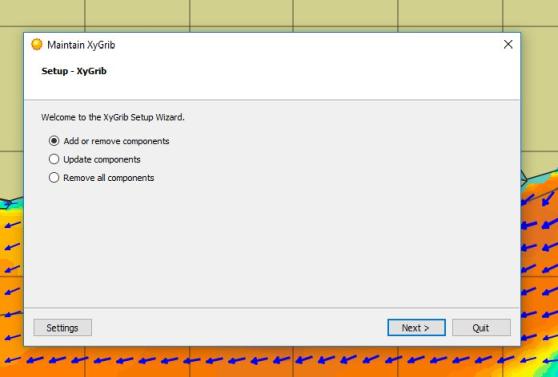
In the maintenance tool select Add/Remove components...
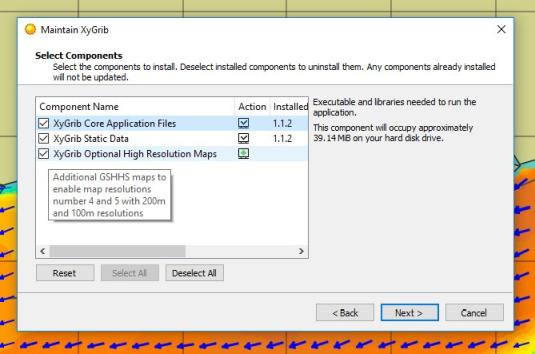
... and then select the optional high resolution maps for download and installation
After installation of maps finishes, restart XyGrib and then resolutions 4 and 5 will be available. Resulting details of coastlines can be seen
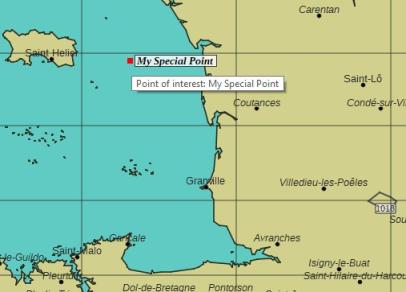
Points of interest provide a hot spot for opening a meteotable that details weather on a timeline for that point.
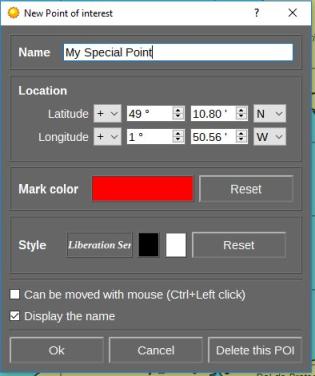
To create a point of interest right click on the map and this dialog will open. In it you can set a name for the point of interest and also manually set the exact geographic coordinates.
Points of interest can be turned on or off via the “Earth” menu selection. They can also be edited by right clicking on them. Points of interest are saved automatically and will reappear on future use of XyGrib
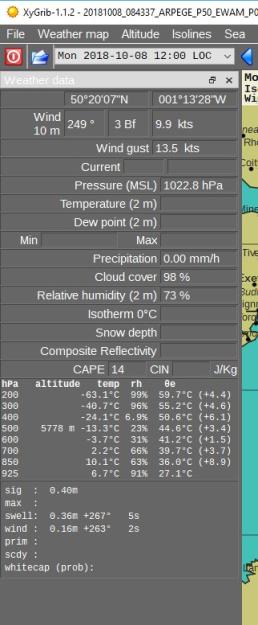
The weather data board on the left of the application window shows the meteorological values of each parameter at the cursor location
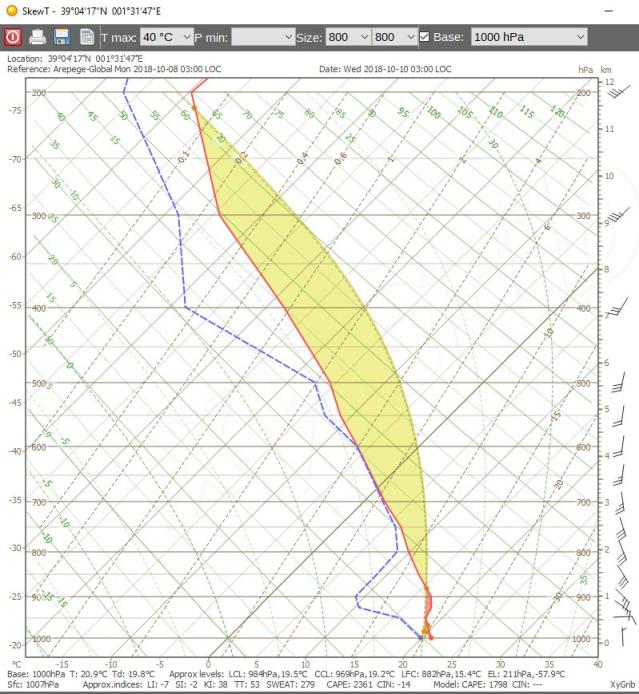
Altitude thermodynamic profile and stability can be shown by creating Skew-T diagrams for any point in the forecast area. This is conditional on having downloaded sufficient altitude data. (The altitude tab includes a selection box for Skew-T which will automatically include required data in the downloaded Grib file)
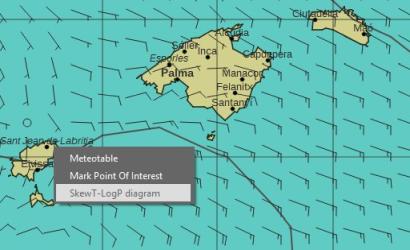
To start, right click on the desired point with the desired time set and choose Skew-T Diagram.
Below is the resulting window with the Skew-T diagram. There is a save button to save as an image. Calculations and data can also be exported to a spreadsheet file
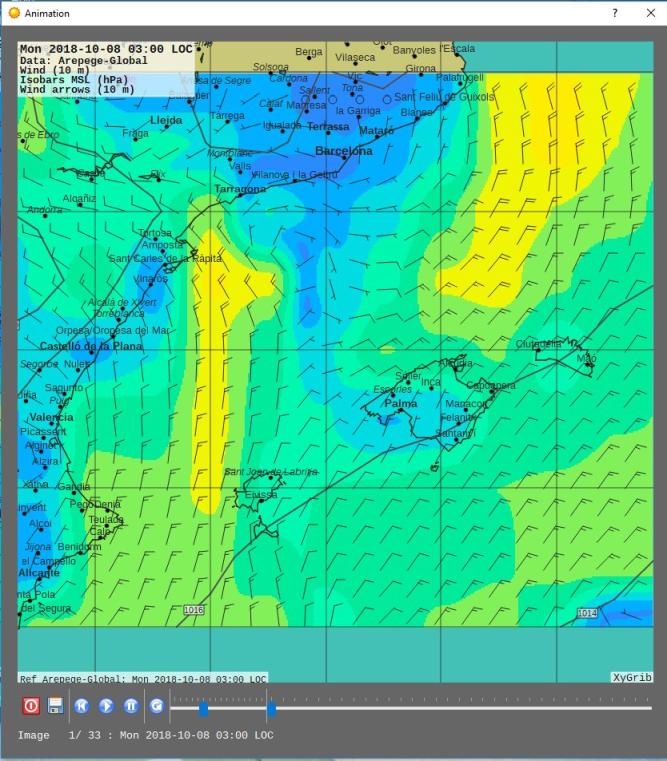
Animations of loaded Grib data in the current display settings can be created by clicking on the rocket icon in the toolbar or by selecting "File->Create Animation" in the menu.
The resulting dialog can replay the animation at adjustable speeds and the series of images can be saved by hitting the save button. This is useful for publishing visualizations.
