You signed in with another tab or window. Reload to refresh your session.You signed out in another tab or window. Reload to refresh your session.You switched accounts on another tab or window. Reload to refresh your session.Dismiss alert
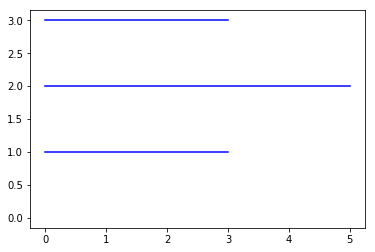
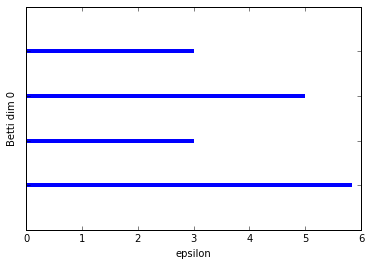
I'm new to Dionysus (and to studying homology persistence),when I try to use Dionysus2 to achieve the learning-demo(from http://outlace.com/TDApart5.html),I got a problem which the plot_bars missing the longest bar in Betti 0,but the plot_bars work in Betti 1 is right.
My achieve
should be
this is my code:
import numpy as np
import dionysus as d
from __future__ import print_function

data = np.array([[1,4],[1,1],[6,1],[6,4]],dtype='double')
f = d.fill_rips(data, 2, 8.0)
p = d.homology_persistence(f)
dgms = d.init_diagrams(p, f)

d.plot.plot_bars(dgms[0],order='birth')
Hi Dimitriy,
I'm new to Dionysus (and to studying homology persistence),when I try to use Dionysus2 to achieve the learning-demo(from http://outlace.com/TDApart5.html),I got a problem which the plot_bars missing the longest bar in Betti 0,but the plot_bars work in Betti 1 is right.
My achieve

should be
this is my code:
when I want to print the p,I got these message:
Thank you very much!
Best,
Jay
The text was updated successfully, but these errors were encountered: