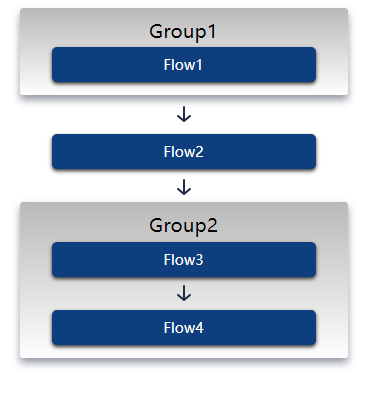
ngx-flowchart is an Angular component to show a flow chart. You can also grouping the flow process.
It was built for modern browsers using TypeScript, CSS3 and HTML5 and Angular 9.1.9.
- Show flow chart by tree data
- Customer styles (Background color, text color, shadow, etc.)
- Responsive
To use ngx-flowchart in your project install it via npm:
npm i ngx-flowchart --save
import { BrowserModule } from '@angular/platform-browser';
import { NgModule } from '@angular/core';
import { NgxFlowchartModule } from 'ngx-flowchart';

import { AppComponent } from './app.component';

@NgModule({
  declarations: [
    AppComponent
  ],
  imports: [
    BrowserModule,
    NgxFlowchartModule
  ],
  providers: [],
  bootstrap: [AppComponent]
})
export class AppModule { }import { Component } from '@angular/core';
import { NgxFlowChatOptions, NgxFlowChatData } from 'ngx-flowchart'
@Component({
selector: 'app-root',
templateUrl: './app.component.html',
styleUrls: ['./app.component.scss']
})
export class AppComponent {
flowData: NgxFlowChatData[] = [
{
id: "1",
name: "Group1",
groupData: [{
id: "2",
name: "Flow1",
}]
},
{
id: "3",
name: "Flow2",
},
{
id: "4",
name: "Group2",
groupData: [{
id: "5",
name: "Flow3",
},
{
id: "6",
name: "Flow4",
}]
},
];
flowOptions: NgxFlowChatOptions = {
groupBackground: 'linear-gradient(to bottom,#b9b9b9 0,#fefefe 50%)',
groupShadow: '0 0.3rem 0.5rem 0 rgba(44,51,73,.5)',
groupBorderRadius: '3px',
groupTextColor: '#000',
background: '#0e3e7d',
shadow: '0 2px 4px 0 #333',
borderRadius: '5px',
textColor: '#fff',
width: '200px'
};
clickN(event) {
console.log(event);
}
}
<ngx-flowchart [data]="flowData" [options]="flowOptions" (clickName)="clickN($event)"></ngx-flowchart>-
data: The tree data. [ { id: "1", name: "Group1", groupData: [{ id: "2", name: "Flow1", }] } ] -
options: Style Options. (json)
| Name | Required | Default Value | Description |
|---|---|---|---|
| width | No | 200px | div min-width |
| groupBackground | No | linear-gradient(rgb(185, 185, 185) 0px, rgb(254, 254, 254) 100%) | Group div background |
| groupShadow | No | 0 0.3rem 0.5rem 0 rgba(44,51,73,.5) | Group div shadow |
| groupBorderRadius | No | 3px | Group div border radius |
| groupTextColor | No | #000 | Group div font color |
| background | No | #0e3e7d | div background |
| shadow | No | 0 2px 4px 0 #333 | div shadow |
| borderRadius | No | 5px | div border radius |
| textColor | No | #fff | div font color |
clickName: Click event, will get the raw data.
- More options (e.g., margin, padding)
- More methods (e.g., mouse hover, mouse double click)
