NOTE: This plugin is no longer maintained and is up for adoption. Be aware that there may be vulnerable dependencies as a result.
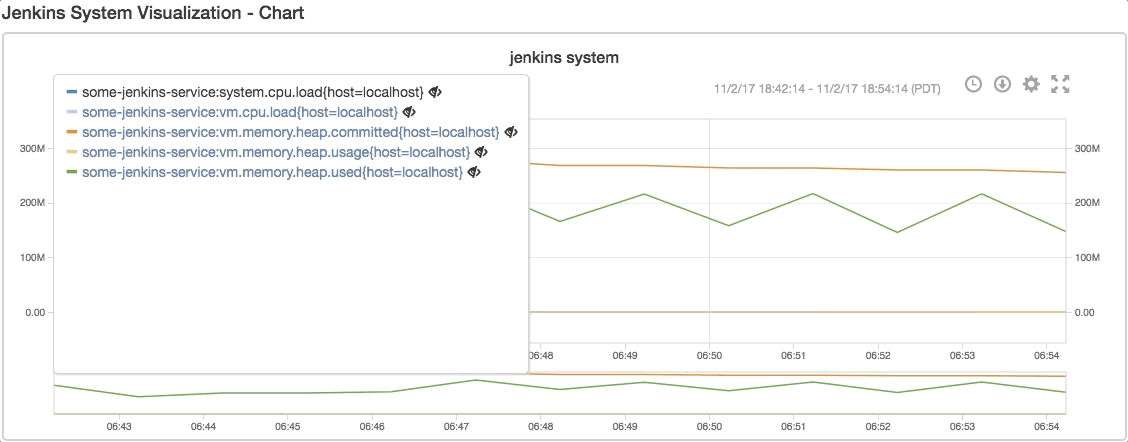
This Jenkins plugin sends build status and build time (including queue time, build time, and total time) to an Argus endpoint. It also sends system metrics from the Metrics plugin. Administrators can configure whether system and build metrics are automatically sent or not.
So, you're using, or considering, the Argus time-series monitoring and alerting platform and you also use Jenkins. Well, hey, you should check this plugin out to easily send Jenkins metrics to Argus.
First, you'll need to have a valid Username with Password credential set up in your Jenkins
credentials. Next, you simply go to Jenkins -> Manage Jenkins -> Configure System and find the
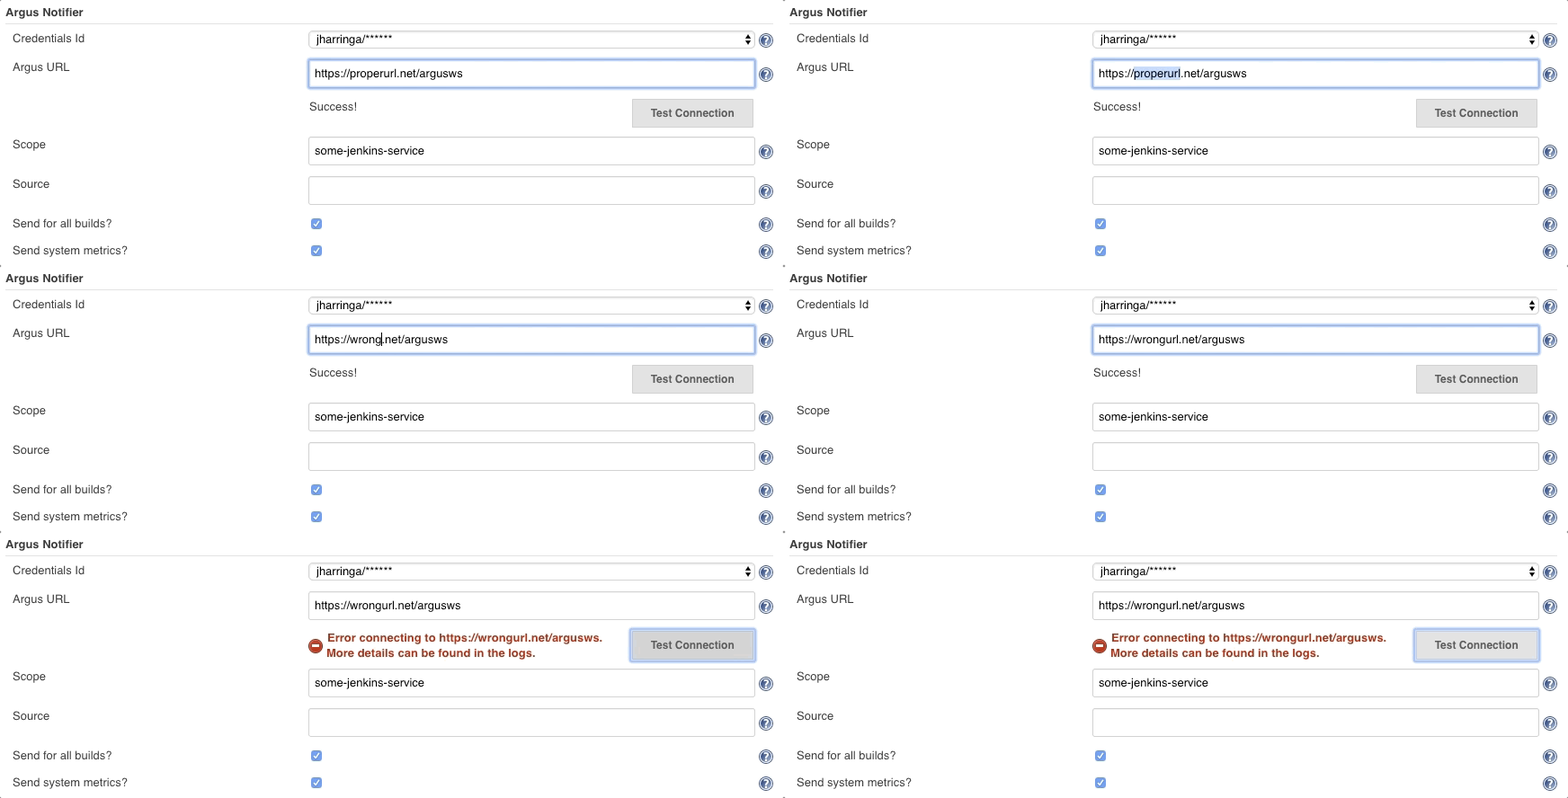
configuration for Argus Notifier. Then you'll configure the following values:
Credentials Id- AUsername with Passwordcredential that has access to your Argus instance.Argus URL- The URL to your Argus web service endpoint.Scope- The Argus scope you'd like to use (typically we use a URL or conceptual name)Source- The Argus source you'd like to use (the plugin will set this toScopeif you don't fill this in)Send for all builds?- Whether you'd like all builds to send build metrics (timings and status) upon build completionSend system metrics?- Whether you'd like the plugin to send system metrics every minute
You can test that your connection works by hitting the Test Connection button as long as
you've selected a valid Credentials Id and filled in your Argus URL. See below:
Once you've saved or applied your Jenkins configuration, the plugin will go to work.
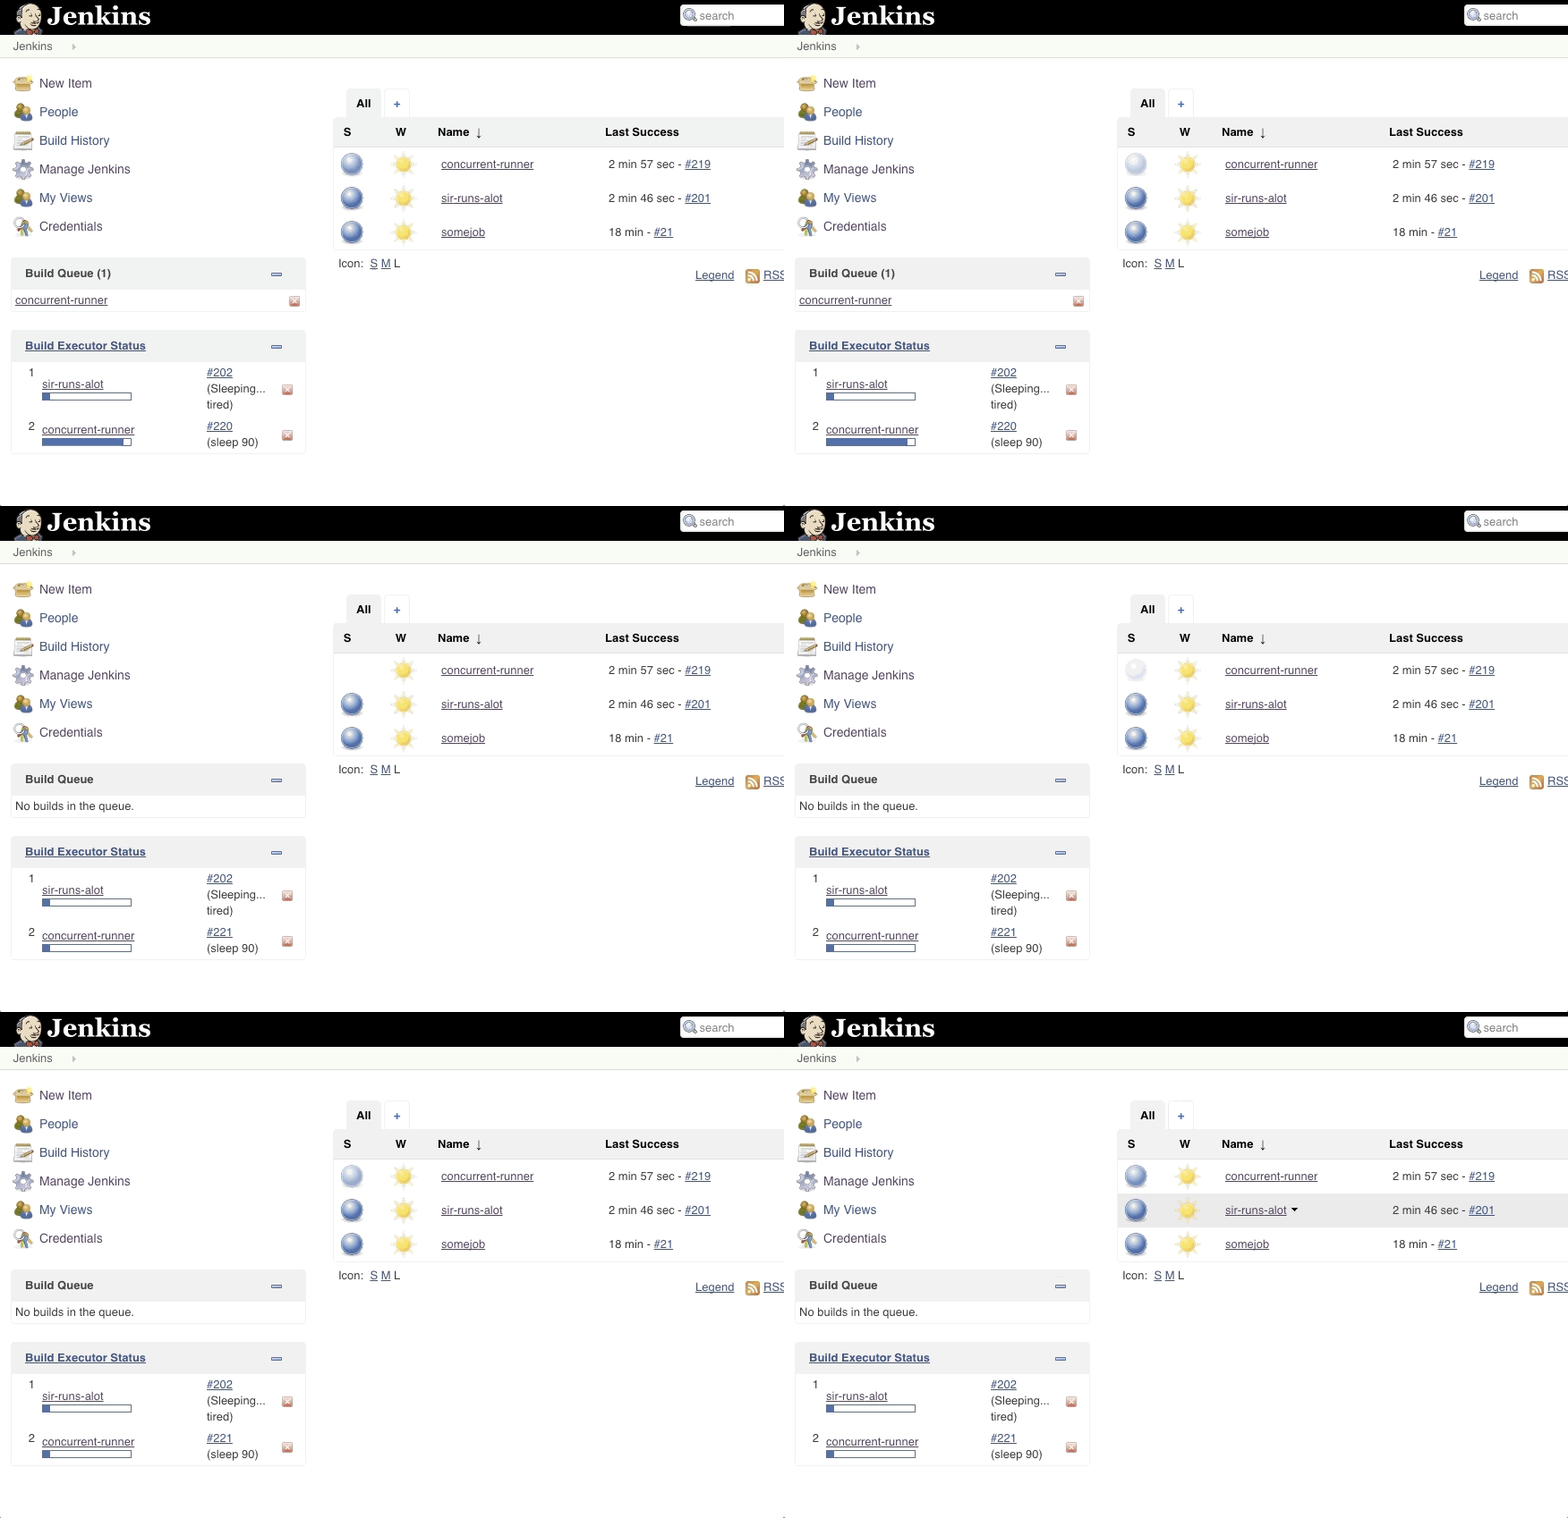
So, let's say we have a few jobs set up on Jenkins and a couple of them run quite a bit:
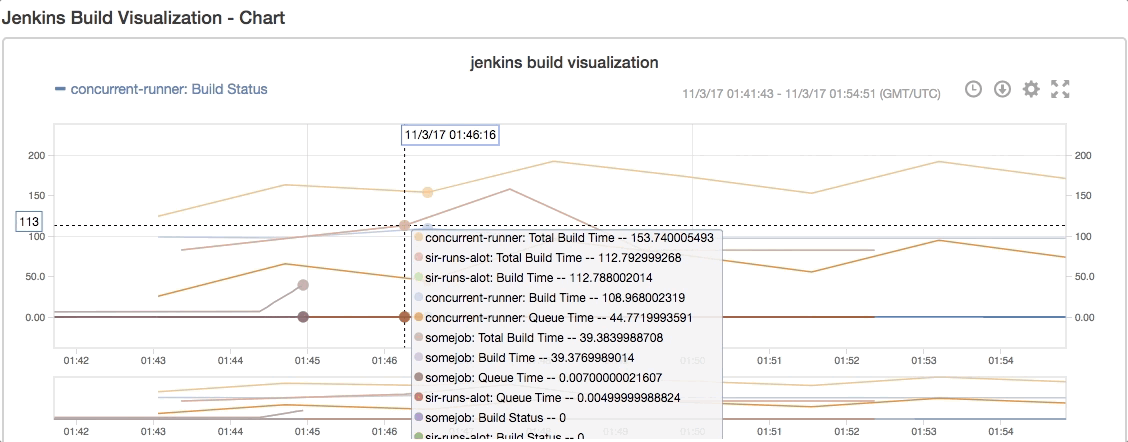
concurrent-runnerruns every minute and sleeps for 90 secondssir-runs-alotruns every 3 minutes, says "yep" and then sleeps for 70 seconds
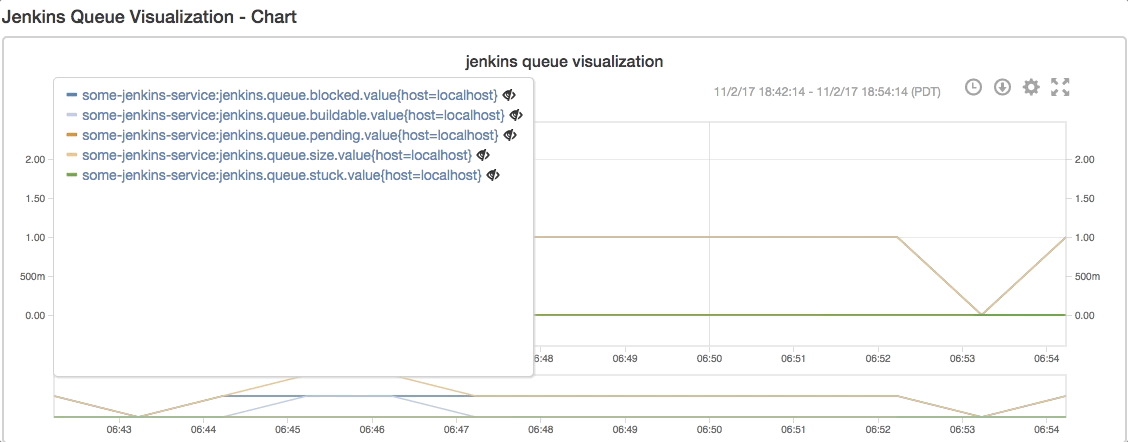
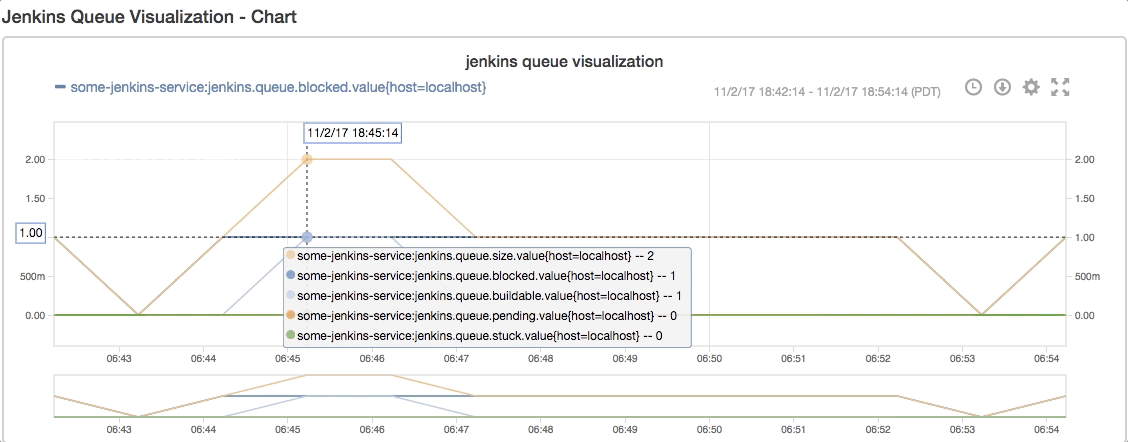
Clearly we're going to have jobs queue up since we only have 2 executors (WHAT?! NO AGENTS!!). So, let's check out our queue metrics in Argus:
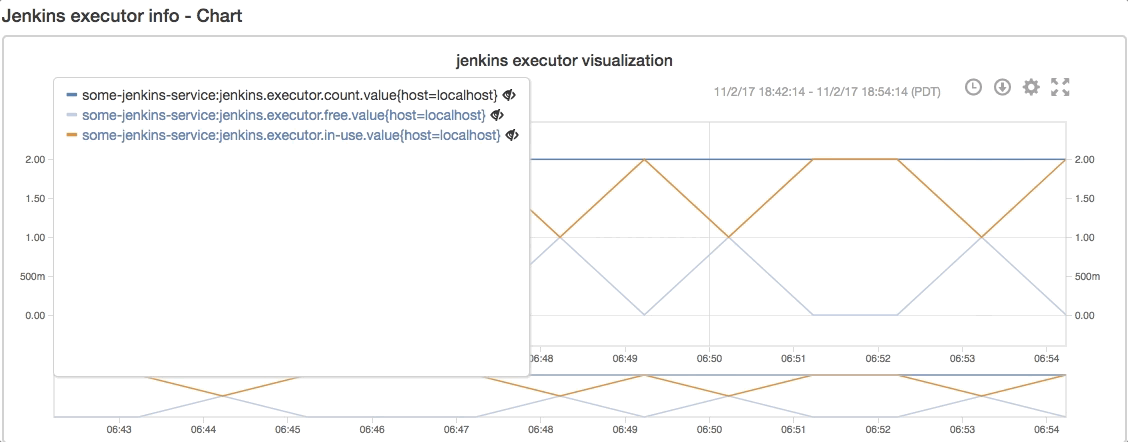
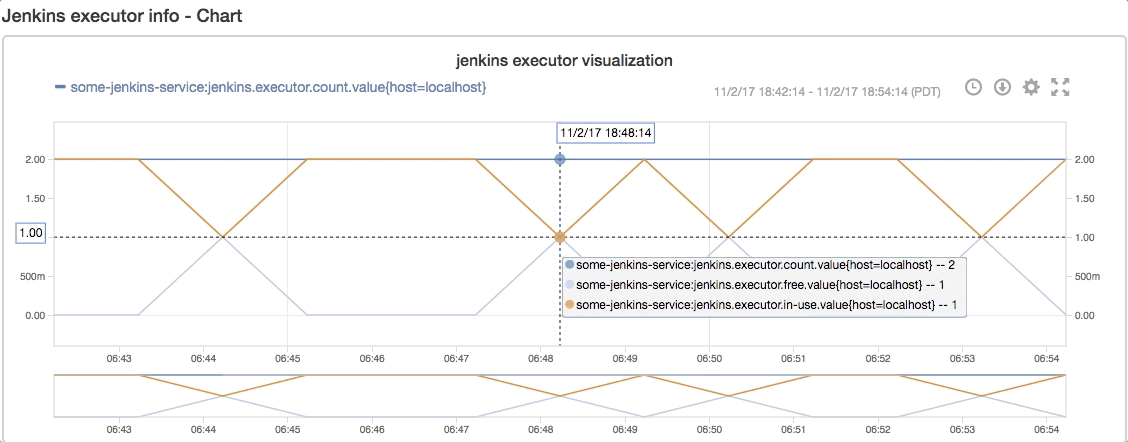
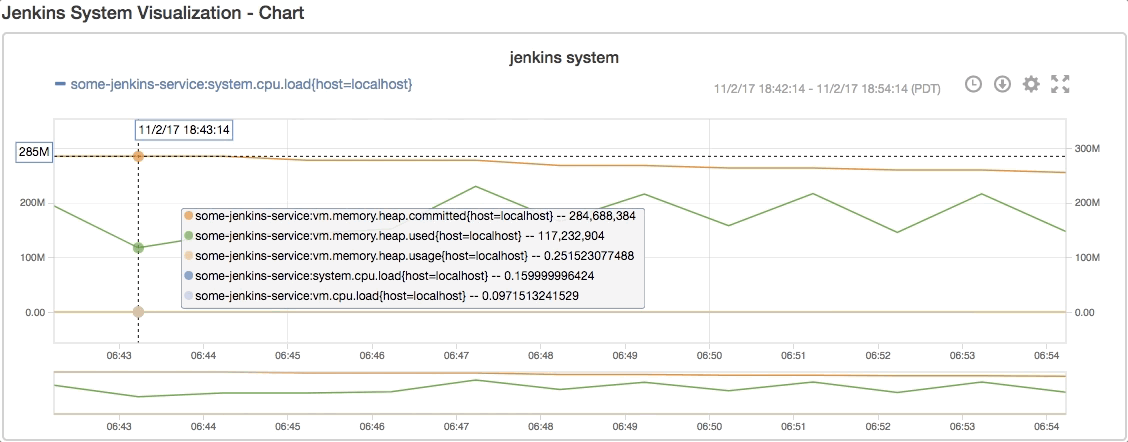
Let's see how those executors are doing...
What about those build runs?
Of course, since Argus is also an alerting platform you could set alerts for any of these metrics. 😄
- Timings are currently sent in units of seconds for consistency
Resultstatuses are mapped to numbers in BuildResultsResolver- Numeric gauge metrics from the Metrics plugin are sent if configured.
- Metrics - used to get the queue time
- Credentials - securely store your Argus credentials
To build the project with Maven, simply run mvn clean package
Run mvn clean hpi:run to start up a test version of Jenkins with the requisite plugins installed.
Run mvn release:prepare release:perform but ensure that your Maven settings.xml has been
set up with your Artifactory password


