This repository contains code and its detailed explanation made for the Master Thesis Performance Profiling for .NET Platform Czech Technical University, Faculty of Electrical Engineering Prague, Czech Republic 2011 - 2012
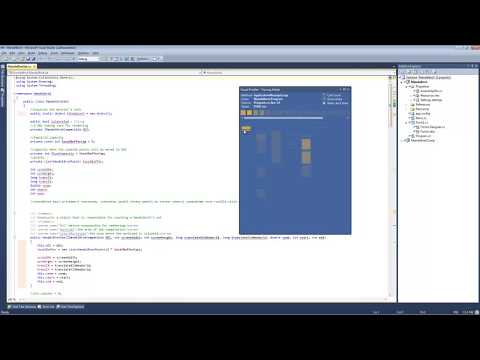
The performance profiling is a powerful way how to get a valuable insight into software applications. In order to be precise and efective, a performance profiler needs to run with low performance and memory overhead and present the result in a transparent way to a developer. In this thesis we analyze performance profiling in the context of Microsoft .NET platform, with focus on the C# programming language, and introduce our own implementation of a profiler, the Visual Profiler. The Visual Profiler features tracing and sampling profiling engines together with an innovative way of presenting the profiling results within the integrated development environment Microsoft Visual Studio 2010.
Here are links to the master thesis and its presentation
- Master thesis in pdf in English
- Final presentation in PDF in Czech
- Final presentation in PPTX in Czech
Assembler, C++, COM, Profiling API, Win32 API, Named pipes, .NET, C#, Ninject, Linq, NUnit, Moq, WPF, XAML, Visual Studio 2010 Extension API, VSIX packages, MEF…
-
The Install directory contains the VSIX package for deploying the Visual Profiler extension into Visual Studio 2010 and a C# fi le for enabling profiling on assemblies.
-
The Source directory contains the source code of this thesis, its dependencies and the Mandelbrot testing application. There are three solutions:
- VisualProfiler.sln - the main solution, contains VisualProfilerBackend, VisualProfilerAccess, VisualProfilerUI
- Mandlerbrot\Mandelbrot.sln - the testing application, contains Mandelbrot and MandelbrotComp projects
- Ccimetadata\Metadata.sln - the Common Compiler Infrastructure Metadata API, contains projects for reading PDB files
-
The Thesis directory contains the PDF document of this thesis.
