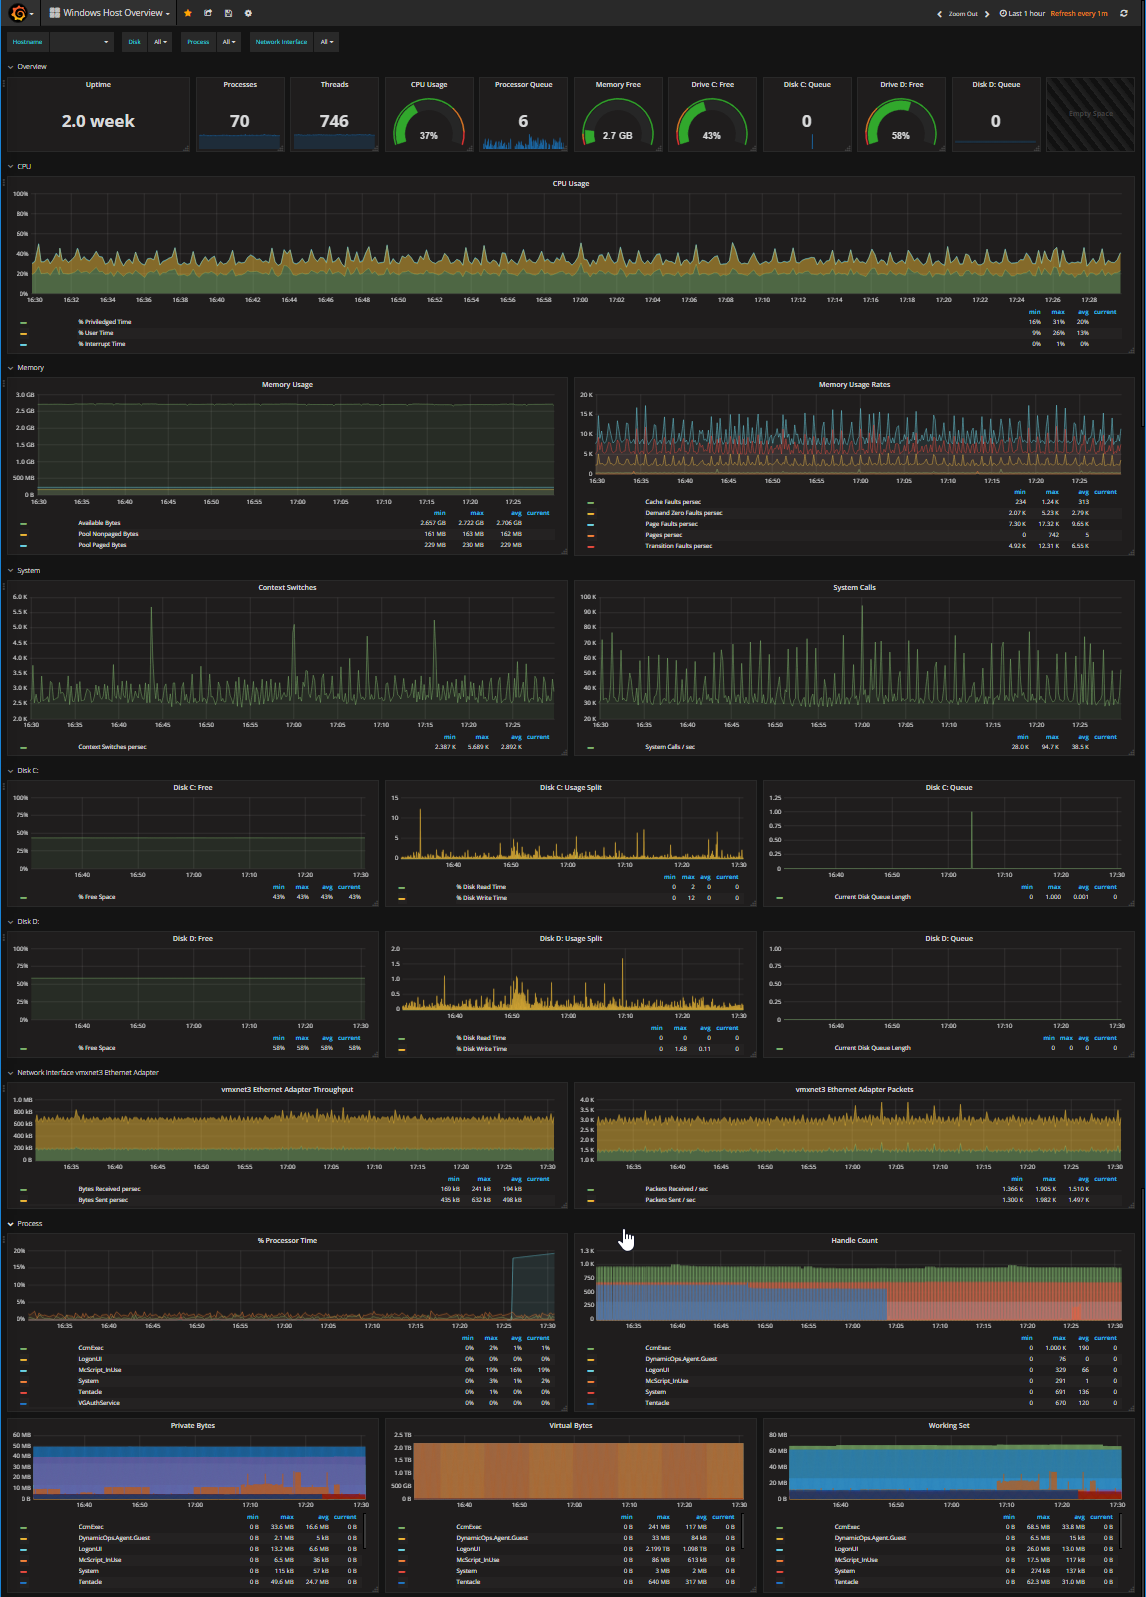
A Grafana 4 dashboard for Windows hosts, requires InfluxDB and Telegraf stats saved into it.
Your telegraf config inputs section needs to look like this:
###############################################################################
#                                  INPUTS                                     #
###############################################################################

# Windows Performance Counters plugin.
# These are the recommended method of monitoring system metrics on windows,
# as the regular system plugins (inputs.cpu, inputs.mem, etc.) rely on WMI,
# which utilize more system resources.
#
# See more configuration examples at:
#   https://github.com/influxdata/telegraf/tree/master/plugins/inputs/win_perf_counters

[[inputs.win_perf_counters]]
  [[inputs.win_perf_counters.object]]
    # Processor usage, alternative to native, reports on a per core.
    ObjectName = "Processor"
    Instances = ["*"]
    Counters = [
      "% Idle Time",
      "% Interrupt Time",
      "% Privileged Time",
      "% User Time",
      "% Processor Time"
    ]
    Measurement = "win_cpu"
    # Set to true to include _Total instance when querying for all (*).
    #IncludeTotal=false

  [[inputs.win_perf_counters.object]]
    # Disk times and queues
    ObjectName = "LogicalDisk"
    Instances = ["*"]
    Counters = [
      "% Idle Time",
      "% Disk Time",
      "% Disk Read Time",
      "% Disk Write Time",
      "% User Time",
      "% Free Space",
      "Current Disk Queue Length",
      "Free Megabytes",
      "Disk Read Bytes/sec",
      "Disk Write Bytes/sec"
    ]
    Measurement = "win_disk"
    # Set to true to include _Total instance when querying for all (*).
    #IncludeTotal=false

  [[inputs.win_perf_counters.object]]
    ObjectName = "System"
    Counters = [
      "Context Switches/sec",
      "System Calls/sec",
      "Processor Queue Length",
      "Threads",
      "System Up Time",
      "Processes"
    ]
    Instances = ["------"]
    Measurement = "win_system"
    # Set to true to include _Total instance when querying for all (*).
    #IncludeTotal=false

  [[inputs.win_perf_counters.object]]
    # Example query where the Instance portion must be removed to get data back,
    # such as from the Memory object.
    ObjectName = "Memory"
    Counters = [
      "Available Bytes",
      "Cache Faults/sec",
      "Demand Zero Faults/sec",
      "Page Faults/sec",
      "Pages/sec",
      "Transition Faults/sec",
      "Pool Nonpaged Bytes",
      "Pool Paged Bytes"
    ]
    # Use 6 x - to remove the Instance bit from the query.
    Instances = ["------"]
    Measurement = "win_mem"
    # Set to true to include _Total instance when querying for all (*).
    #IncludeTotal=false

  [[inputs.win_perf_counters.object]]
    # more counters for the Network Interface Object can be found at
    # https://msdn.microsoft.com/en-us/library/ms803962.aspx
    ObjectName = "Network Interface"
    Counters = [
      "Bytes Received/sec",
      "Bytes Sent/sec",
      "Packets Received/sec",
      "Packets Sent/sec"
    ]
    Instances = ["*"] # Use 6 x - to remove the Instance bit from the query.
    Measurement = "win_net"
    #IncludeTotal=false #Set to true to include _Total instance when querying for all (*).

  [[inputs.win_perf_counters.object]]
    # Process metrics
    ObjectName = "Process"
    Counters = [
      "% Processor Time",
      "Handle Count",
      "Private Bytes",
      "Thread Count",
      "Virtual Bytes",
      "Working Set"
      ]
    Instances = ["*"]
    Measurement = "win_proc"
    #IncludeTotal=false #Set to true to include _Total instance when querying for all (*).
