When two or more predictors are highly correlated to each other such that one predictor can be derived using the linear combinations of other predictors, then the predictors are said to be collinear
Standardisation is a scclaing technique in which values are shifted and rescaled so that the mean is 0 and the variance is 1
Normalization is a scaling technique in which values are shifted and rescaled so that they end up ranging between 0 and 1. It is also known as Min-Max scaling
- Algorithms which use gradient descent based optimisation (linear regression, logistic regression, neural networks) will require features to be scaled so that optimization will be faster and the convergence will be more accurate.
- Having features on a similar scale can help the gradient descent converge more quickly towards the minima.
- Distance algorithms like KNN, K-means, and SVM are most affected by the range of features. This is because behind the scenes they are using distances between data points to determine their similarity.
- Therefore, we scale our data before employing a distance based algorithm so that all the features contribute equally to the result.
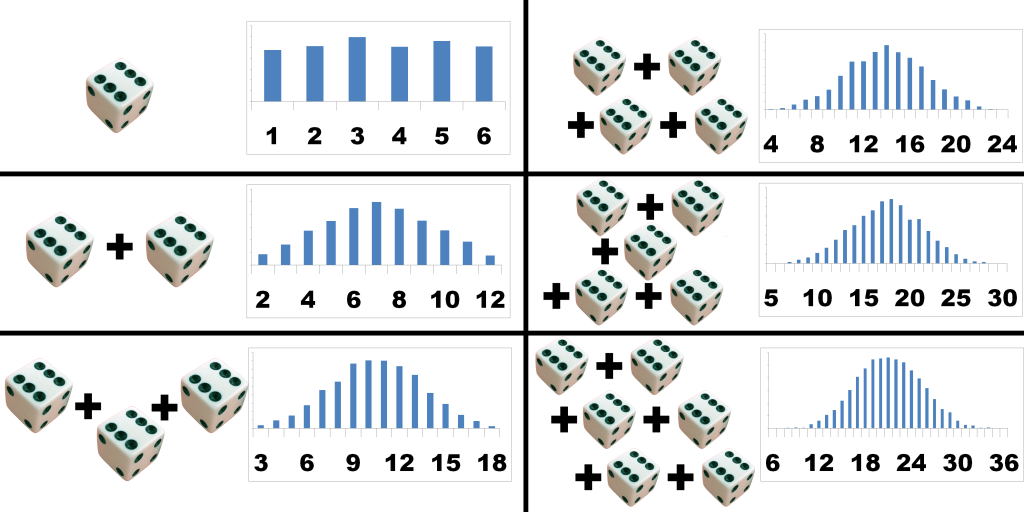
The Central Limit Theorem is about how the sum of many different independent random variables tends towards a normal distribution (bell curve).
For example: suppose you're rolling 2 6-sided dice. The rolls are all independent because one of the rolls doesn't affect any of the other rolls. For a single die, the distribution is the same chance for 1 2 3 4 5 and 6.
But of you add the sum of 2 dice, you will notice that you have a 1/36 chance to get a 2, 2/36 chance to get a 3, 3/36 chance to get a 4, ..., up until 6/36 chance of getting a 7, then the chance decreases again until you're back at 1/36 chance of getting a 12. This is because the values in the middle, like 7, can be reached by getting 1+6, 6+1, 2+5, 5+2, 3+4 and 4+3, whereas the edges like 2 require a single very specific result (1+1) where every single die needs to land on 1.
If you further increase the number of dice you roll, the edge cases become less and less likely, because they keep requiring very specific results, whereas the results in the middle become more likely. The more dice you add, the more it will eventually look like a bell curve.
The interquartile range is a measure of where the “middle fifty” is in a data set. Where a range is a measure of where the beginning and end are in a set, an interquartile range is a measure of where the bulk of the values lie. That’s why it’s preferred over many other measures of spread when reporting things like school performance or SAT scores.
The interquartile range formula is the first quartile subtracted from the third quartile: IQR = Q3 – Q1.
Use the interquartile range formula with the mean and standard deviation to test whether or not a population has a normal distribution. The formula to determine whether or not a population is normally distributed are: Q1 – (σ z1) + X Q3 – (σ z3) + X Where Q1 is the first quartile, Q3 is the third quartile, σ is the standard deviation, z is the standard score (“z-score“) and X is the mean. In order to tell whether a population is normally distributed, solve both equations and then compare the results. If there is a significant difference between the results and the first or third quartiles, then the population is not normally distributed.
The interquartile range and the quartile deviation refer to the same thing. They both mean the difference between the third quartile (Q3) and the first quartile (Q1). Both are also called midspread or middle fifty.
Some of its applications include determining the spread of data. It is used in the construction of a box plot. It is a good indicator of spread because it is robust with breakpoint of 25%. A breakpoint percentage indicates the number of incorrect observations, before a parameter starts giving a wrong description of the data set. A 25% breakpoint is robust, as it needs a quarter of the data to be incorrect, before it reflects an incorrect spread.
The IQR is also used to determine outliers to the data set. This is in conjuction with the box plot (or the box-and-whisker plot). Outliers are defined as values that are below Q1-1.5IQR or above Q3+1.5IQR. There are other methods that could be used to determine whether outliers can be eliminated from the data set.
| Basis | Z Test | T-Test |
|---|---|---|
| Basic Definition | Z-test is a kind of hypothesis test which ascertains if the averages of the 2 datasets are different from each other when standard deviation or variance is given. | The t-test can be referred to as a kind of parametric test that is applied to an identity, how the averages of 2 sets of data differ from each other when the standard deviation or variance is not given. |
| Population Variance | The Population variance or standard deviation is known here. | The Population variance or standard deviation is unknown here. |
| Sample Size | The Sample size is large. | Here the Sample Size is small. |
| Key Assumptions | All data points are independent. Normal Distribution for Z, with an average zero and variance = 1. | All data points are not dependent. Sample values are to be recorded and taken accurately. |
| Based upon (a type of distribution) | Based on Normal distribution. | Based on Student-t distribution. |
Read about Besel correction for more technical definition
If you are giving the standard deviation of an entire population and not a sample you actually do divide by n. However, the denominator is not referencing the number of observations, it's actually referencing degrees of freedom, which is n-1. For you to understand degrees of freedom I would recommend this example using hats.
Basically you divide by the number of things you need to 'know' before you can fill in the blanks yourself. If you are using an entire population, you need every single example as you can't just fill in the blanks. But if you have a sample, you can know all but the last one before you can fill in the blank.
Imagine you have a huge bookshelf. You measure the total thickness of the first 6 books and it turns out to be 158mm. This means that the mean thickness of a book based on first 6 samples is 26.3mm. Now you take out and measure the first book's thickness (one degree of freedom) and find that it is 22mm. This means that the remaining 5 books must have a total thickness of 136mm Now you measure the second book (second degree of freedom) and find it to be 28mm. So you know that the remaining 4 books should have a total thickness of 108mm . . . In this way, by the time you measure the thickness of the 5th book individually (5th degree of freedom) , you automatically know the thickness of the remaining 1 book.
This means that you automatically know the thickness of 6th book even though you have measured only 5. Extrapolating this concept, In a sample of size n, you know the value of the n'th observation even though you have only taken (n-1) measurements. i.e, the opportunity to vary has been taken away for the n'th observation.
This means that if you have measured (n-1) objects then the nth object has no freedom to vary. Therefore, degree of freedom is only (n-1) and not n.
We can divide the basic assumptions of linear regression into two categories based on whether the assumptions are about the explanatory variables (i.e. features) or the residuals.
- Linearity
- No multicollinearity
- Gaussian distribution
- Homoskedasticity
- No autocorrelation
- Zero conditional mean
8. What are the different approches to outlier detection ? How will you handle the outliers? Why is it useful ?
Three statistics are used in Ordinary Least Squares (OLS) regression to evaluate model fit:
- R-squared,
- the overall F-test, and
- the Root Mean Square Error (RMSE).
All three are based on two sums of squares: Sum of Squares Total (SST) and Sum of Squares Error (SSE). SST measures how far the data are from the mean, and SSE measures how far the data are from the model’s predicted values. Different combinations of these two values provide different information about how the regression model compares to the mean model.
The difference between SST and SSE is the improvement in prediction from the regression model, compared to the mean model. Dividing that difference by SST gives R-squared. It is the proportional improvement in prediction from the regression model, compared to the mean model. It indicates the goodness of fit of the model.
R-squared has the useful property that its scale is intuitive: it ranges from zero to one, with zero indicating that the proposed model does not improve prediction over the mean model, and one indicating perfect prediction. Improvement in the regression model results in proportional increases in R-squared.
One pitfall of R-squared is that it can only increase as predictors are added to the regression model. This increase is artificial when predictors are not actually improving the model’s fit. To remedy this, a related statistic, Adjusted R-squared, incorporates the model’s degrees of freedom. Adjusted R-squared will decrease as predictors are added if the increase in model fit does not make up for the loss of degrees of freedom. Likewise, it will increase as predictors are added if the increase in model fit is worthwhile. Adjusted R-squared should always be used with models with more than one predictor variable. It is interpreted as the proportion of total variance that is explained by the model.
There are situations in which a high R-squared is not necessary or relevant. When the interest is in the relationship between variables, not in prediction, the R-square is less important. An example is a study on how religiosity affects health outcomes. A good result is a reliable relationship between religiosity and health. No one would expect that religion explains a high percentage of the variation in health, as health is affected by many other factors. Even if the model accounts for other variables known to affect health, such as income and age, an R-squared in the range of 0.10 to 0.15 is reasonable.
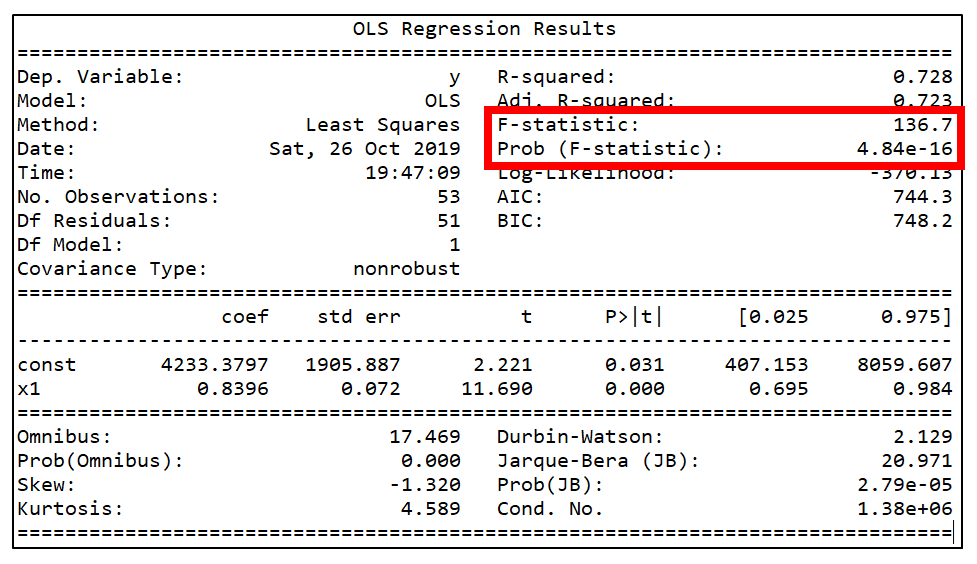
The F-test evaluates the null hypothesis that all regression coefficients are equal to zero versus the alternative that at least one is not. An equivalent null hypothesis is that R-squared equals zero. A significant F-test indicates that the observed R-squared is reliable and is not a spurious result of oddities in the data set. Thus the F-test determines whether the proposed relationship between the response variable and the set of predictors is statistically reliable and can be useful when the research objective is either prediction or explanation.
The RMSE is the square root of the variance of the residuals. It indicates the absolute fit of the model to the data–how close the observed data points are to the model’s predicted values. Whereas R-squared is a relative measure of fit, RMSE is an absolute measure of fit. As the square root of a variance, RMSE can be interpreted as the standard deviation of the unexplained variance, and has the useful property of being in the same units as the response variable. Lower values of RMSE indicate better fit. RMSE is a good measure of how accurately the model predicts the response, and it is the most important criterion for fit if the main purpose of the model is prediction.
NOTE: The best measure of model fit depends on the researcher’s objectives, and more than one are often useful. The statistics discussed above are applicable to regression models that use OLS estimation. Many types of regression models, however, such as mixed models, generalized linear models, and event history models, use maximum likelihood estimation.
where y is the label (1 for event and 0 for non-event) and p(y) is the predicted probability of the event happening for all N observations. Reading this formula, it tells you that, for each time the event occcurs (y=1), it adds log(p(y)) to the loss, that is, the log probability of event happening. Conversely, it adds log(1-p(y)), that is, the log probability of event not happening, for each non-event (y=0)
Say you have three job offers and you wish to decide which is the best among them, you have the following criterion you use to shortlist a job offer like
- tools and technology
- company brand
- health insurance
- support for education
- compensation
- travel time
- joining bonus etc.
You reach out to 10 of your connections on LinkedIn and ask them which is the best comapny to join based on 3 random criteria (for eg. c2, c3, c5) You make different combinations of criteria while asking to different connections. At the end, you finally select company which is recommended the most from all the responses.
19. You are a placement coordinator, you have to design a system for resume recommendation aligning to a company's requirement ?
a. K means clustering to make clusters b. Ranking algorithm to sort for relevance
Second Strategy
a. Perform document similarity using Hamming distance (distance based approach) b. Compute the JD document distance with the resumes c. Shortlist top K resumes
Target mean encoding
| Algorithm | Problem Identification | Evaluation Metric | Bias Variance | Impact of outliers | Impact of imbalanced data | |
|---|---|---|---|---|---|---|
| Linear Regression | Regression | - Coefficient of determination (R2) - Adjusted R2 - Root Mean Square Error (RMSE) - Mean Absolute Error (MAE) - Root Mean Squared Logarithmic Error (RMSLE) | - High Bias Low Variance | -Impacted by outliers | ||
| Logistic Regression | Classification | - Accuracy - Precision - Recall - F-beta score - Area under ROC curve | - High Bias Low Variance | -Impacted by outliers | ||
| Support Vector Machines | Classification | - Accuracy - Precision - Recall - F-beta score - Area under ROC curve | - Low Bias High Variance | Sensitive to outliers | Sensitive to imbalanced data | |
| K-nearest neighbors | Classification | - Accuracy - Precision - Recall - F-beta score - Area under ROC curve | - Low Bias High Variance | Sensitive to outliers | Sensitive to imbalanced data | |
| Decision Tree | Both | Both | - Low Bias High Variance | - Not impacted by outliers | - Not impacted by imbalanced data | |
| Random Forest | Both | Both | - Low Bias High Variance | - Not impacted by outliers | - Not impacted by imbalanced data | |
| K-means clustering | Clustering | - Elbow method - Silhoutte Analysis | Senstive to Outliers | |||
22. Why do CNNs perfom better with images ? (What is it that CNN achieve better than ANN when delaing with image data)
24. Does a low coefficient of determination always mean that my model is bad or vice versa ? Explain.
- R-squared does not measure goodness of fit.
- R-squared does not measure predictive error.
- R-squared does not allow you to compare models using transformed responses.
- R-squared does not measure how one variable explains another.
Bias ia how well the model fits the data. Variance tells us the magnitude of change in the model based on the change in data a. Very simple models have high bias and low variance eg. linear models b. Very complex models have low bias and high variance eg. tree based models. Hence they are more prone to overfitting.
How to deal with them ?
| High Bias | High Variance | |
|---|---|---|
| Try getting additional features | Try getting more training examples | |
| Try adding polynomial features | Try smaller set of features | |
| Try to decrease the regularization parameter | Try to increase the regularization parameter |
overlapping of sample does not happen for k-folds cross validation


