-
Notifications
You must be signed in to change notification settings - Fork 3
Architecture
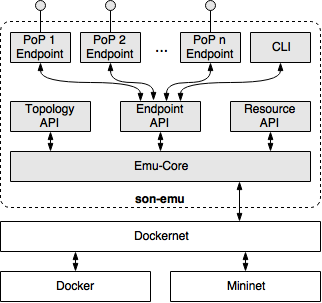
The vim-emu system design follows a highly customizable approach that offers plugin interfaces for most of its components, like cloud API endpoints, container resource limitation models, or topology generators. The following figure shows the main components of our system and how they interact with each other. The emulator core component implements the emulation environment, e.g., the emulated PoPs. It is the core of the system and interacts with the topology API to load test topology definitions. The resource management API allows to connect resource limitation models that define how much resources, like CPU time and memory, are available in each PoP. The flexible cloud endpoint API allows our system to be extended with different interfaces that can be used by MANO systems to manage and orchestrate emulated services. Finally, we provide an easy-to-use CLI that allows developers to manually perform MANO tasks, like starting/stopping VNFs while our platform is running.

In contrast to classical Mininet topologies, vim-emu topologies do not describe single network hosts connected to the emulated network. Instead, they define available PoPs which are logical cloud data centers in which compute resources can be started at emulation time. In the most simplified version, the internal network of each PoP is represented by a single SDN switch to which compute resources can be connected, like shown in the figure above. This can be done as the focus is on emulating multi-PoP environments in which a MANO system has full control over the placement of VNFs on different PoPs but limited insights about PoP internals. We extended Mininet's Python-based topology API with methods to describe and add PoPs. The use of a Python-based API has the benefit of enabling developers to use scripts to define or algorithmically generate topologies. Besides an API to define emulation topologies, an API to start and stop compute resources within the emulated PoPs is needed. To do so, vim-emu uses the concept of flexible cloud API endpoints. A cloud API endpoint is an interface to one or multiple PoPs that provides typical infrastructure-as-a-service (IaaS) semantics to manage compute resources. Such an endpoint could be an OpenStack Nova or HEAT like interface, a specific interface for SONATA's SP, or a simplified interface to which SONATA service packages can be uploaded (dummy gatekeeper). These endpoints can be easily implemented by writing small, Python-based modules that translate incoming requests (e.g., an OpenStack Nova start compute) to emulator specific requests (e.g., start Docker container in PoP1).
The dummy gatekeeper module tries to provide the basic functionality of SONATA's service platform needed to initially deploy a service package created by the SDK. It is a more lightweight solution than using the emulator with a full-featured MANO system and it supports the usage of SDK tools, like son-access. The dummy gatekeeper uses the same API as the real gatekeeper implementation and provides the following (limited) set of features:
- REST endpoint to upload a *.son service package (onboard)
- Extract service package and parse relevant parts of the contained descriptors
- Download and optionally build referenced Docker images
- REST endpoint to trigger instantiations of an uploaded service (instantiate)
- Simple placement logics (pluggable Python scripts)
- Instantiation of each VNF described in the service
- SDN-based chain setup between instantiated VNFs (based on VLANs)
- REST endpoints to list uploaded and instantiated services
The 5GTANGO LLCM module is an improved version of SONATA's dummy gatekeeper and allows to directly on-board and instantiate 5GTANGO network service packages. Example 2 shows how to use this module.
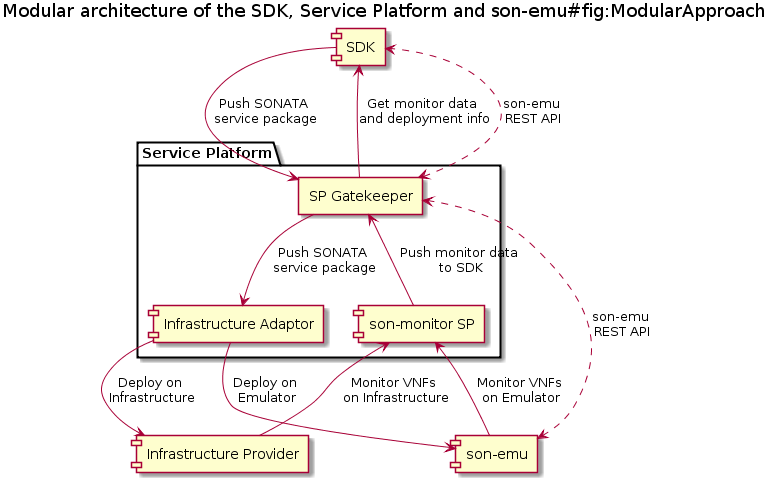
It is the intention that the emulator can integrate with SONATA's SP. The SP can then deploy, manage and control network services on the emulation platform like any on other infrastructure domain. In this case it would make sense to also let the SP's monitoring framework work with vim-emu. To achieve this, the monitored metrics gathered inside the emulator, should be exported in a compatible way so they can be read and stored by the standard SONATA SP monitoring framework. The use of containers and the SDN-based networking in the emulator allow a wide range of metrics that can be captured relatively easy and provide useful information to a service developer:
- service-generic metrics
- For each deployed VNF or forwarding chain, some default metrics such as container compute/memory/storage parameters or network traffic rate can be monitored.
- service-specific metrics
- By exploiting the NFV/SDN based features of the emulator, more detailed parameters such as end-to-end delay, jitter or specific network flows can be monitored.
To prepare the emulator as much as possible for integration with the SP, the same metrics gathering system is used, which is based on Prometheus. Further details on this monitoring framework are given here.

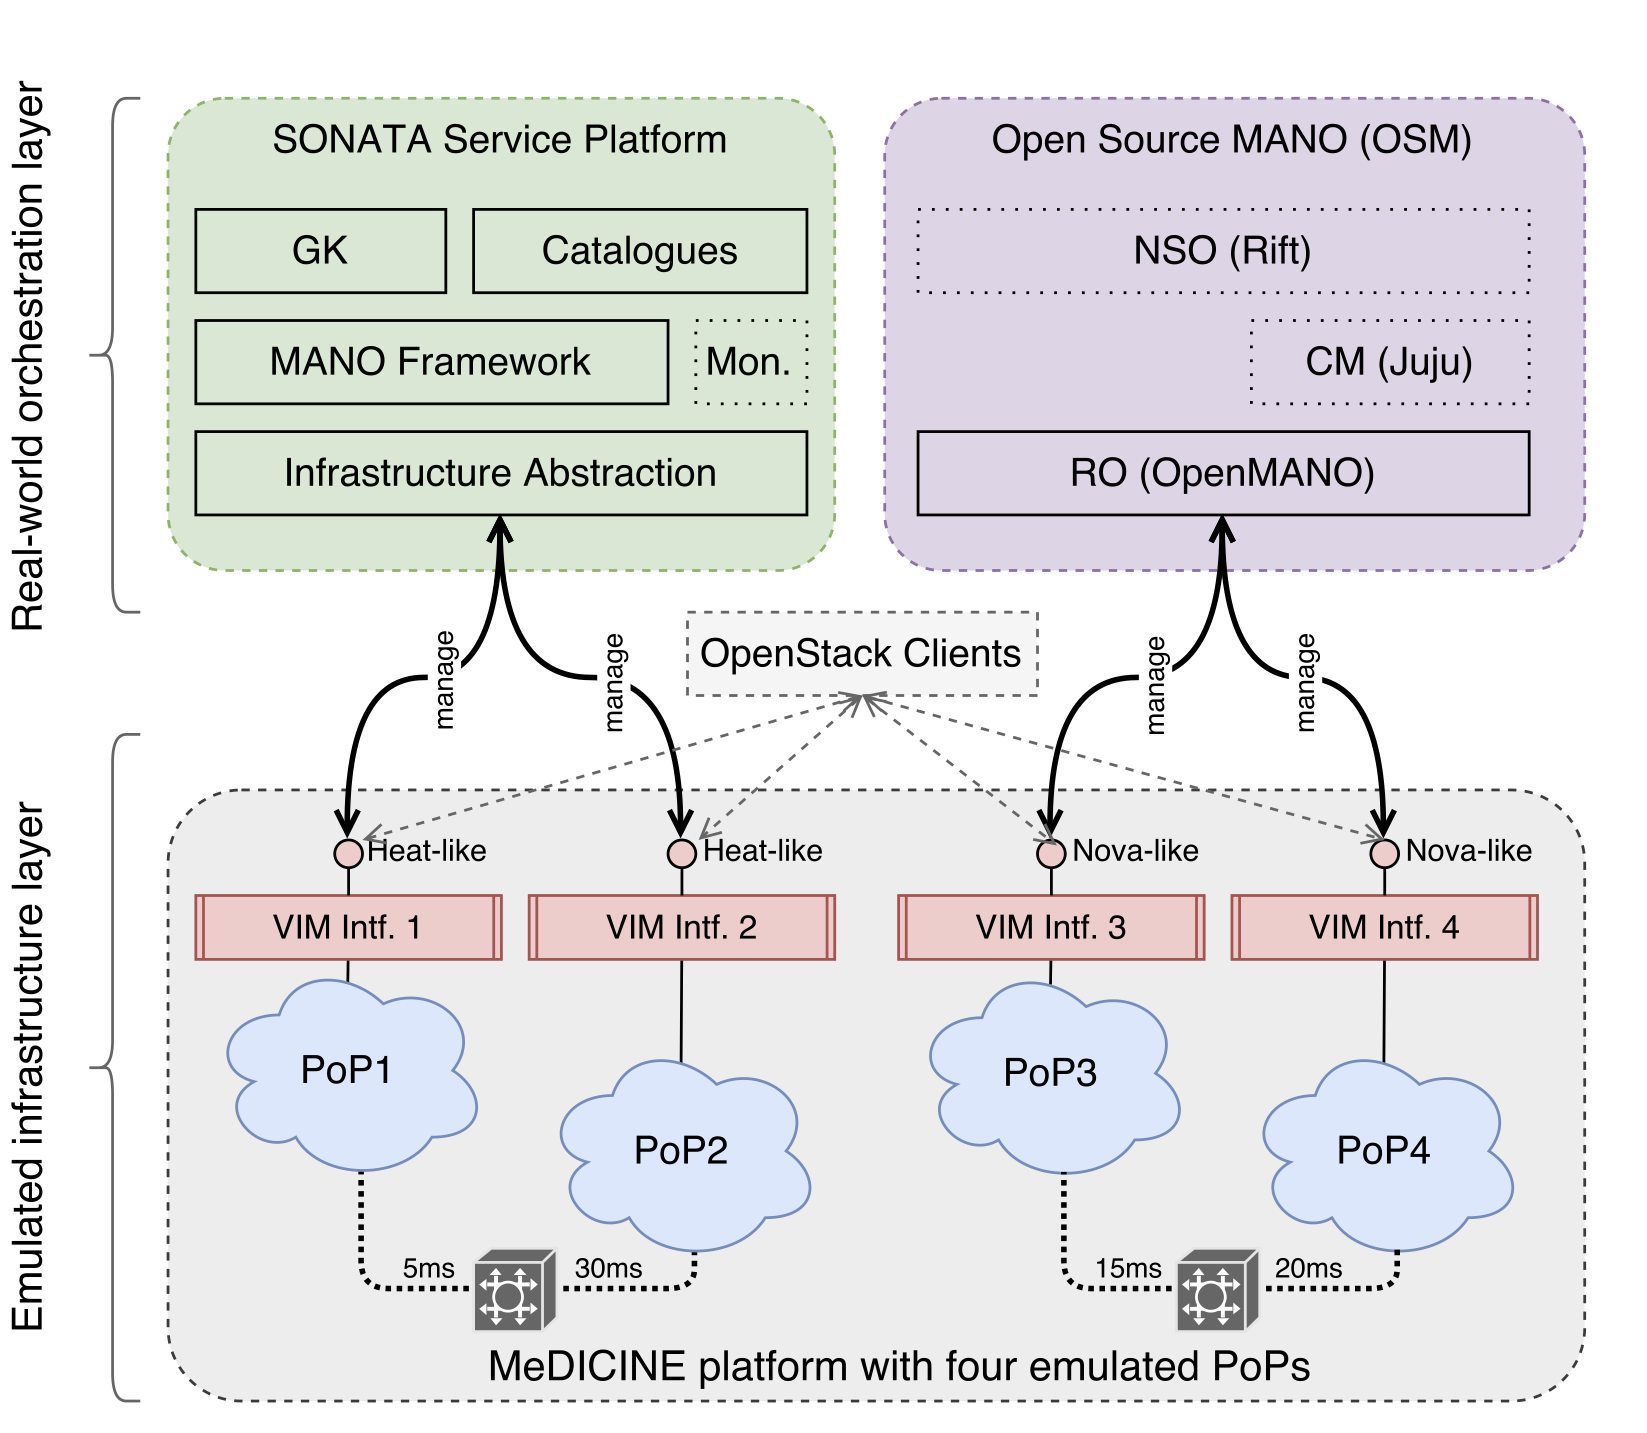
Besides testing network services locally using vim-emu and its dummy gatekeeper, it is highly desirable to be able to integrate our multi-PoP emulation platform with real-world orchestration solutions, like the SONATA service platform and let these solutions control the emulated infrastructure. To do so, we identified two different approaches to enable the easy integration between our emulated environment and real-world MANO systems. The first approach is to implement customized driver plugins that support our emulation platform for each MANO system. The second approach is to add already standardized interfaces to our emulation platform which can then be directly used by off-the-shelf MANO installations. Since we want to support as much MANO solutions as possible and keep the development overhead low, we decided to go for the second approach. More specifically, we realized it by adding OpenStack-like interfaces to our platform, because practically every MANO system comes with driver plugins for the OpenStack APIs.

As illustrated, our platform automatically starts OpenStack-like control interfaces for each of the emulated PoPs which allow MANO systems to start, stop and manage VNFs. This approach has a good level of abstraction and we have been able to implement the needed set of API endpoints required by the SONATA and OSM orchestrators in less than 3.8k lines of Python code. Specifically, our system provides the core functionalities of OpenStack's Nova, Heat, Keystone, Glance, and Neutron APIs. Even though not all of these APIs are directly required to manage VNFs, all of them are needed to let the MANO systems believe that each emulated PoP in our platform is a real OpenStack deployment. From the perspective of the MANO systems, this setup looks like a real-world multi-VIM deployment, i.e., the MANO system's southbound interfaces can connect to the OpenStack-like VIM interfaces of each emulated PoP. A YouTube video showcases the described setup with OpenSource MANO integration.
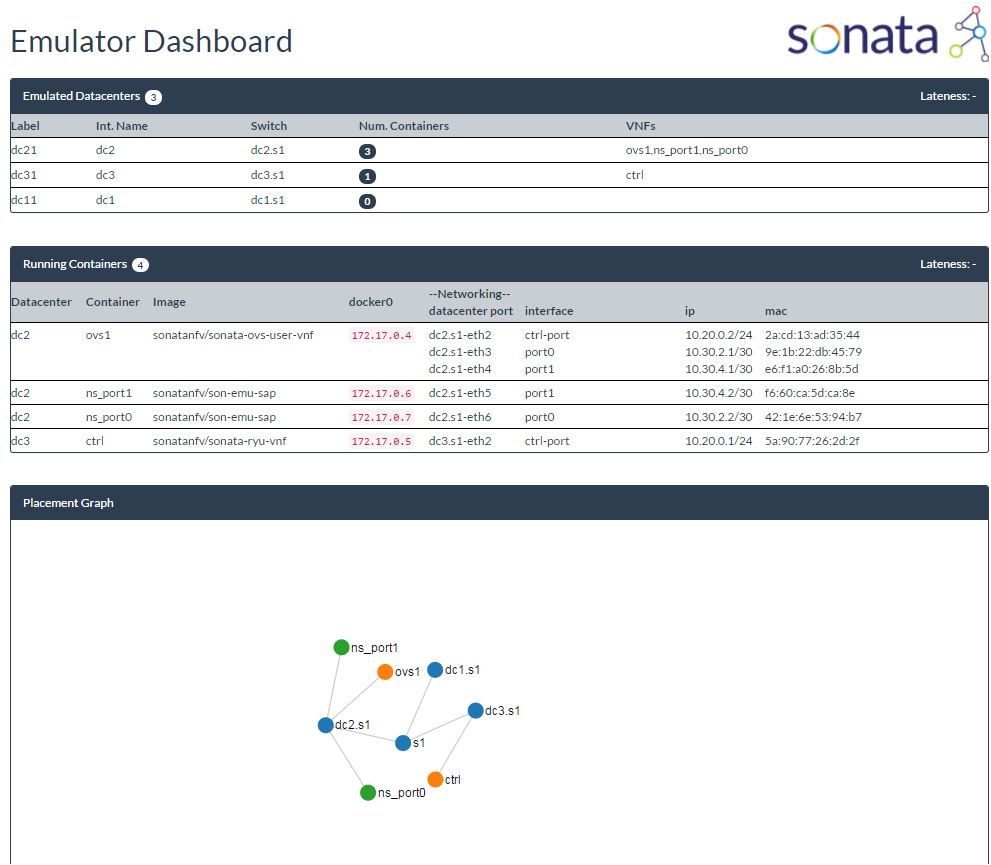
vim-emu as such is a system-level tool that offers multiple command line interfaces to the user. This offers a high-level of control and the possibility to script and automate experiment setups. However, to get a quick overview about the emulated system and especially to demonstrate the emulator we decided to add a graphical web-based dashboard to the emulator. This dashboard is served by an internal web server which is also responsible to host the REST APIs of the emulator. The dashboard as such is implemented in JavaScript and polls the REST interfaces to visualize the system's state as shown in the following figure. The dashboard shows a list of emulated PoPs, their labels, internal names and responsible software switches. In addition it shows all running containers that are deployed on the emulated infrastructure. This makes it easy to explain an audience what is happening inside the emulation platform and for a service developer to get a quick overview of the deployed service in the SDK emulator environment. The information given in the dashboard, can be used, similar to what a Network Service Record (NSR) file would contain if the service was deployed in the Service Platform.
